As virtualization of mission-critical applications is now common place, customers are increasingly looking to run mixed/multiple workloads on their chosen infrastructure. Its now common that shared storage be it SAN or Hyperconverged (HCI) is used and these days most products have some form of storage tiering and/or read/write buffers.
It is also common for storage to have one or more data reduction technologies such as Deduplication, Compression & Erasure Coding.
A quick note on Exchange support requirements: You must have storage which enforces Forced Unit Access (FUA) / Write Through (when requested by the Guest OS) which means data must be written to persistent media (not a write cache) before being acknowledged to the guest OS/application.
For more information on how Nutanix is complaint (regardless of Hypervisor) see the following post: Ensuring Data Integrity with Nutanix – Part 2 – Forced Unit Access (FUA) & Write Through
Now back to Jetstress performance testing. When considering a storage platform, or migrating an existing workload onto your shared storage its a no brainer to run the tried and tested MS Exchange Jetstress tool to validate storage performance, right?
Well, not necessarily, and here’s why.
When using Jetstress, you typically create multiple databases, e.g.: 8 and spread them across multiple virtual disks. Jetstress then creates the 1st database and proceeds to duplicate it “X” number of times, in this example, an additional 7 times.
Here is a screenshot showing Jetstress creating a 159.9GB database and then duplicating it 3 times.
Problem 1: Jetstress duplicates databases multiple times, leading to unrealistic deduplication ratios.
Arguably deduplication should not be used for DAG deployments, which I have discussed previously, but putting that issue to one side, what about for performance testing with Jetstress? Well think about it, if we have 8 databases, 7 of which are exact copies of the 1st, then of course we will see great deduplication ratios.
As a result of say an 8:1 deduplication ratio, it means 8x more data will be served out of the cache/SSD tier/s leading to unrealistically high performance and low latency.
No matter what any vendor tells you, 8:1 dedupe for Exchange (excluding DAG copies) is not realistic for production data in my experience. As such, it should never be used for performance testing with Jetstress.
Solution: Disable dedupe when using Jetstress (and in my opinion for production DAGs)
Problem 2: Jetstress databases contain lots of zeros which can be easily compressed.
In the real world, I personally recommend compression for Exchange databases (not logs) with or without DAG deployments, as compressing data can achieve excellent data reduction while not removing copies of data deliberately created by the DAG. It lowers the cost/GB and even increases performance in some storage systems especially when writing to or accessing the data on the slower cold tier. (In fact it can lead to more usable capacity than RAW, but caution your milage may vary.)
However, databases created through Jetstress are packed with a ton of zeros, which means compression ratios are also much higher than real world. I’ve seen >7:1 compression ratios for Jetstress databases, which as with dedupe, means more data will be served out of the cache/SSD tier/s leading again to unrealistically high performance and low latency.
Solution: Disable compression when using Jetstress
Problem 3: Jetstress performs random read/write I/O across the entire data set
This is a valid test for deployments using physical servers & JBOD as the databases are spread across multiple drives (usually SATA) and there is no tiering between drives. As such, testing I/O across the entire data set concurrently is importaint.
It is also a reasonable test for shared storage if no tiering is being used, as with many legacy storage solutions.
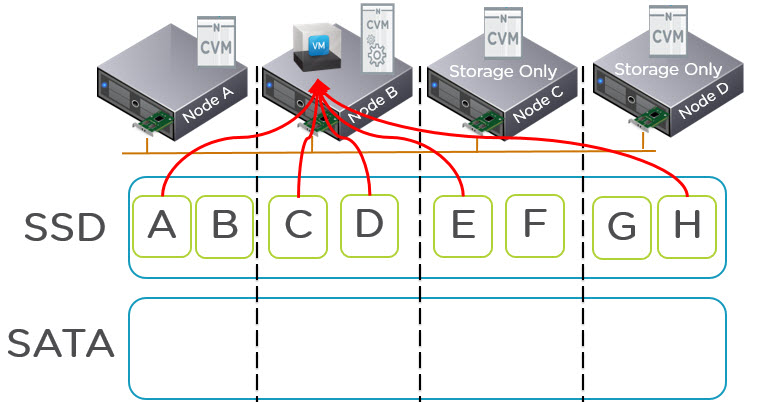
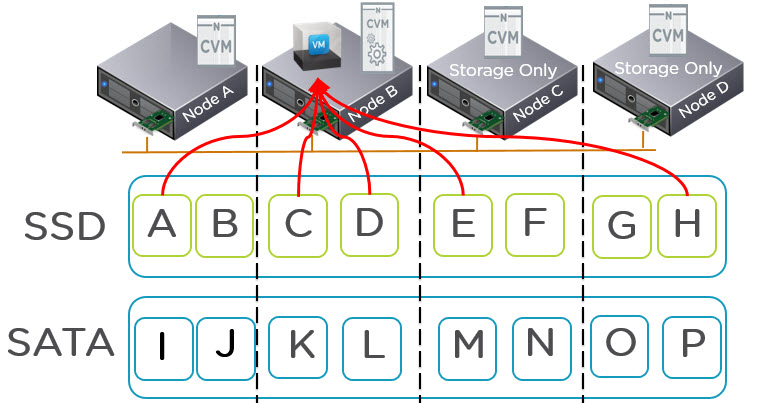
However, when you have intelligent storage with tiering, such as Nutanix Distributed Storage Fabric (NDSF), Write I/O is always served by the SSD tier and the coldest data is tiered off to SATA. Then only if required, cold data is served by the SATA tier.
As such, the larger the Exchange mailbox size, typically the higher the percentage of data will be cold which means and increasingly smaller percentage of total capacity needs to be SSD to give all flash type performance the vast majority of the time. This also allows customers to maintain large mailboxes cost effectively and with consistent performance on SATA. As such I believe hybrid storage (Small SSD tier w/ large low cost capacity tier) is advantageous to Exchange but that’s another topic.
Because Jetstress actively performs I/O as if all data is hot, it effectively negates the benefits of tiering which is not demonstrating the real world performance of a tiered storage platform such as Nutanix. For Nutanix solutions the application will have similar to all flash performance even with TBs of mailbox databases sitting on SATA since active I/O is predominantly serviced by SSD. The small percentage of I/O serviced by the SATA tier performs much better than JBOD since the I/O to those drives is limited thanks to all new/active data being served by the SSD tier.
As such, to get an idea of real world performance, Jetstress tests need to be performed on a carefully sized databases which fit within the (persistent) performance tier (i.e.: not RAM style cache, which Nutanix calls the Extent Cache which is typically a few GB per node). This test should easily produce a passing result for Jetstress.
This style test will show you close to what real world performance looks like although I also recommend what I call a Worst case scenario test which I cover later in this post.
This 2nd Jetstress test is the one you want to make sure is under 20ms Database Read Latency and 10ms Log Write latency which are the Microsoft accepted thresholds for performance for Exchange.
Problem 4: Jetstress performs lots of overwrites
As Jetstress runs, it performs frequent random overwrites within the databases, which in my experience does not represent real world behaviour. So a Jetstress Pass result is really a strong indication the solution will perform well if the Achieved IOPS are >= the MS Exchange Server Role Requirements Calculator estimates (which is a good thing!)
But, Nutanix uses a technology called Erasure Coding (EC-X) for data reduction, which is designed specifically for use with cold data. That is data such as older email in a large mailbox. EC-X is recommended for production Exchange environments as it provides more usable capacity and is complementary to Compression.
But when overwrites occur, NDSF re-stripes the data which has a small write penalty, which in the real world is insignificant as it happen infrequently. But with Jetstress performing constant overwrites, EC-X provides limited/no data reduction and decreases performance.
As such, this is another case where benchmarks do not properly represent real world performance, so when using Jetstress, ensure EC-X is not enabled.
For non Nutanix storage platforms, large numbers of overwrites will typically also reduce Jetstress performance compared to real world where the percentage of overwrites will be much lower.
How to Test on Tiered Storage solutions.
If the vendor does not have a Microsoft ESRP certification (Nutanix ESRP can be found here), then you should validate the infrastructure is capable of supporting your requirements.
If the vendor does have ESRP then should still use Jetstress as an Operational Verification tool following initial implementation and prior to going into production.
In this example I will specifically cover Nutanix Distributed Storage Fabric (NDSF), while the below may be applicable to other vendor products, please refer to each vendors recommendations although all data reduction recommendations should be consistent across vendors in my opinion.
Solution: Perform two stages of Jetstress testing.
Stage 1: All flash performance test
If the SSD tier has 1TB usable, make the Jetstress databases total 75% of the usable capacity (in the case of Nutanix, 75% of the per node SSD usable capacity per Jetstress instance).
Run a short 15 min test and fine tune the threads starting from 32 and reduce until you achieve <4x the required IO levels according to the MS Exchange Server Role Requirements Calculator (4x should be easy to achieve for All flash testing at low latency), then run a 24 hour Stress test with all Jetstress instances concurrently (Multi-Host Test).
This result should be indicative (although not exactly) of the performance you should see under normal circumstances.
Stage 2: Worst case scenario test (90% capacity)
If the usable capacity is 1TB (per node), then make the Jetstress databases total >90% of the usable capacity (in the case of Nutanix, per node usable capacity per Jetstress instance). Nutanix recommends N+1 for any mission-critical application, so the actual cluster utilisation for a 4 node cluster would be ~67.5% utilised (100% – 25% for N+1 creating DBs to use 90% of the other nodes capacity).
Note: Larger clusters equate to higher usable percentage of capacity, e.g.: An 8 node cluster would be 100% – 12.5% for N+1 – 10% = ~78% capacity for the cluster).
Run a short 15 min test and fine tune the threads starting from 12 and reduce until you achieve >= the required IO levels according to the MS Exchange Server Role Requirements Calculator (which has 20% buffer built in), then run a 24 hour Stress test with all Jetstress instances concurrently (Multi-Host Test).
The worst case scenario test shows how the system will perform if the tiering/cache layers are totally saturated, hence the name worst case scenario. This is how Nutanix runs testing for Microsoft ESRP certification to ensure every Nutanix deployment for Exchange performs flawlessly in production.
Real World vs Jetstress
I will be publishing a case study on this topic in the future, but to give you a teaser, a 30k Seat Exchange deployment I designed and validated had roughly 700 IOPS @ 5-15ms Read/Write latency on the Jetstress worst case scenario test and the SSD only Jetstress report was ~4000 IOPS @ 1-2ms for Read and Write I/O. In production the average latency is 3-4ms and the number of messages per day is within +2% of the estimates in the MS Exchange Server Role Requirements Calculator.
The cluster average latency includes read and write I/O as well as other workloads sharing the cluster.
As you can see, a Jetstress result showing 15ms doesn’t sound very impressive, yet the SSD test is super impressive considering the thread count could have been increased to provided higher IOPS, but since the requirement was <500 IOPS, the 4000 IOPS achieved was well in excess of what was required so no further testing was performed.
But now that you understand why Jetstress is not designed for modern tiered shared storage, you can use the above mentioned tests to ensure you get results which are indicative to real world performance and not be fooled by data reduction (Dedupe/Compression) giving you unrealistic high performance.
Summary:
When using tiered storage with MS Exchange Jetstress, ensure:
- Deduplication is disabled (as it should be for production DAGs)
- Compression is disabled
- Erasure Coding (EC-X) is disabled (Nutanix specific)
Once the above is complete, run the following Jetstress tests:
- All performance tier test to see best case scenario performance (Indicative of real world performance)
- 90% capacity performance test to show worst case scenario performance (which should rarely if ever be experienced)
Related Articles:


