In-Kernel verses Virtual Storage Appliance

Let me start by asking, What’s all this “In-Kernel verses Virtual Storage Appliance” debate all about?

It seems to me to be total nonsense yet it is the focus of so called competitive intelligence and twitter debates. From an architectural perspective I just don’t get why it’s such a huge focus when there are so many other critical areas to focus on, like the benefit of Hyper-Converged vs SAN/NAS!!!

Saying In-Kernel or VSA is faster than the other (just because of where the software runs) is like saying my car with 18″ wheels is faster than your car with 17″ wheels. In reality there are so many other factors to consider, the wheel size is almost irrelevant, as is whether or not storage is provided “In-Kernel” or via a “Virtual Appliance”.

If something is In-Kernel, it doesn’t mean it’s efficient, it could be In-Kernel and really inefficient code, therefore being much worse than a VSA solution, or a VSA could be really inefficient and an In-Kernel solution could be more efficient.

In addition to this, Hyper-converged solutions are by design scale-out solutions, as a result the performance capabilities are the sum of all the nodes, not one individual node.

As long as a solution can provide enough performance (IOPS) per node for individual (or scaled up) VMs and enough scale-out to support all the customers VMs, it doesn’t matter if Solution A is In-Kernel or VSA, or that the solution can do 20% or even 100% more IOPS per node compared to solution B. The only thing that matters is the customers requirements are met/exceeded.

Let’s shift focus for a moment and talk about the performance capabilities of the ESX/ESXi hypervisor as this seems to be argued as an significant overhead which prevents a VSA from being high performance. In my experience , ESXi has never been a significant I/O bottleneck, even for large customers with business critical applications as the focus on Biz Critical Apps really took off around the VI3 days or later where the hypervisor could deliver ~100K IOPS per host.

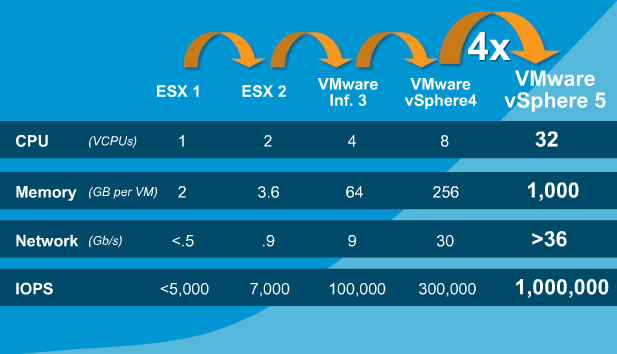
The below is a chart showing VMware’s tested capabilities from ESX 1, through to vSphere 5 which was released in July 2011.

IOPSvmware

What we can clearly see is vSphere 5.0 can achieve 1 Million IOPS (per host), and even back in the VI3 days, 100,000 IOPS.

In 2011, VMware wrote a great article “Achieving a Million I/O Operations per Second from a Single VMware vSphere® 5.0 Host” which shows how the 1 million IOPS claim has been validated.

In 2012 VMware published “1 million IOPS On 1VM” which showed not only could vSphere achieve a million IOPS, but it could do it from 1 VM.

I don’t know about you, but it’s pretty impressive VMware has optimized the hypervisor to the point where a single VM can get 1 million IOPS, and that was back in 2012!

Now in both the articles, the 1 million IOPS was achieved using a traditional centralised SAN, the first article was with an EMC VMAX with 8 engines and I have summarized the setup below.

  • 4 quad-core processors and 128GB of memory per engine
  • 64 front-end 8Gbps Fibre Channel (FC) ports
  • 64 back-end 4Gbps FC ports
  • 960 * 15K RPM, 450GB FC drives

The IO profile for this test was 8K , 100% read, 100% random.

For the second 1 million IOPS per VM test, the setup used 2 x Violin Memory 6616 Flash Memory Arrays with the below setup.

  • Hypervisor: vSphere 5.1
  • Server: HP DL380 Gen8
    CPU: 2 x Intel Xeon E5-2690, HyperThreading disabled
    Memory: 256GB
  • HBAs: 5 x QLE2562
  • Storage: 2 x Violin Memory 6616 Flash Memory Arrays
  • VM: Windows Server 2008 R2, 8 vCPUs and 48GB.
    Iometer Config: 4K IO size w/ 16 workers

For both configurations, all I/O needs to traverse from the VM, through the hypervisor, out HBAs/NICs, across a storage area network, through central controllers and then make the return journey back to the VM.

There is so many places where additional latency or contention can be introduced in the storage stack it’s amazing VMs can produce the level of storage performance they do, especially back 3 years ago.

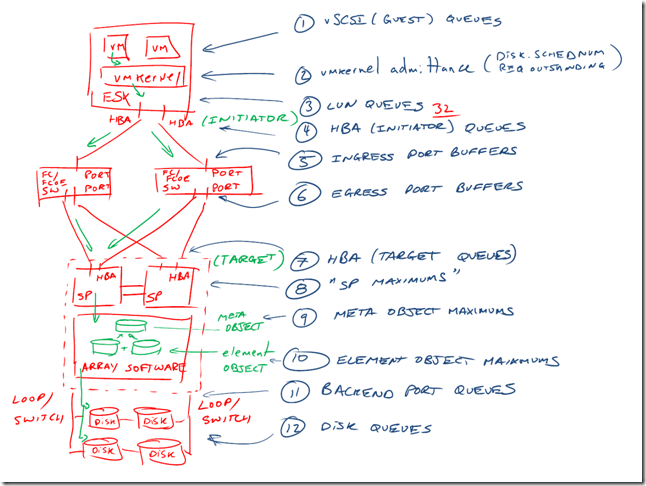
Chad Sakac wrote a great article back in 2009 called “VMware I/O Queues, Microbursting and Multipathing“, which has the below representation of the path I/O takes between a VM and a centralized SAN.

6a00e552e53bd28833011570408872970c

As we can see, Chad shows 12 steps for I/O to get to the disk queues, and once the I/O is completed, the I/O needs to traverse all the way back to the VM, so all in all you could argue it’s a 24 step round trip for EVERY I/O!

The reason I am pointing this out is because the argument around “In-kernel” verses “Virtual Storage Appliance” is only about 1 step in the I/O path, when Hyper-Converged solutions like Nutanix (which uses a VSA) eliminate 3/4’s of the steps in an overcomplicated I/O path which has been proven to achieve 1 million IOPS per VM.

Andre Leibovici recently wrote the article “Nutanix Traffic Routing: Setting the story straight” where he shows the I/O path for VMs using Nutanix.

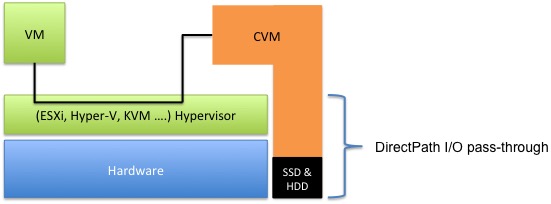
The below diagram which Andre created shows the I/O path (for Read I/O) goes from the VM, across the ESXi hypervisor to the Controller VM (CVM) which then using DirectPath I/O to directly access the locally attached SSD and SATA drives.

nutanix_datapath3

Consider if the VM in the above diagram was a Web Server and the CVM was a database server and they were running in an environment with a SAN/NAS. The Web Server would be communicating to the DB server over the network (via the hypervisor) but the DB Server would have to access it’s data (that the Web Server requested) from the centralized SAN, so in the vast majority of environments today (which are using SAN/NAS) the data is travelling a much longer path than it would compared to a VSA solution and in many cases traversing from one VM to another across the hypervisor before going to the SAN/NAS and back through a VM to be served to the VM requesting the data.

Now back to the diagram, For Nutanix the Read I/O under normal circumstances will be served locally around 95% of the time, this is thanks to data locality and how Write I/O happens.

For Write I/Os, one copy of each piece of data is written locally where the VM is running which means all subsequent Read I/O can be served locally (and freshly written data is also typically “Active data”), and the 2nd copy is replicated throughout the Nutanix cluster. This means even though half the Write I/O (of the two copies) needs to traverse the LAN, it doesn’t hit a choke point like a traditional SAN, because Nutanix scales out controllers on a 1:1 ratio with ESXi hosts and writes are distributed throughout the cluster in 1MB extents.

So if we look back to Chad’s (awesome!) diagram, Hyper-converged solutions like Nutanix and VSAN are only concerned with Steps 1,2,3,12 (4 total) for Read I/O and 1,2,3,12 as well as 1 step for the NIC at the source & 1 step for the NIC at the destination host.

So overall it’s 4 steps for Read, 6 steps for Write, compared to 12 for Read and 12 for Write for a traditional SAN.

So Hyper-converged solutions regardless of In-Kernel or VSA based remove many of the potential points of failure and contention compare to a traditional SANNAS and as a result, have MUCH more efficient data paths.

On twitter recently, I responded to a tweet where the person claims “Hyperconverged is about software, not hardware”.

I disagree, Hyper-converged to me (and the folk at Nutanix) is all about the customer experience. It should be simple to deploy, manage, scale etc, all of which constitute the customers experience. Everything in the datacenter runs on HW, so I don’t get the fuss on the Software only vs Appliance / OEM software only solution debate either, but this is a topic for another post.
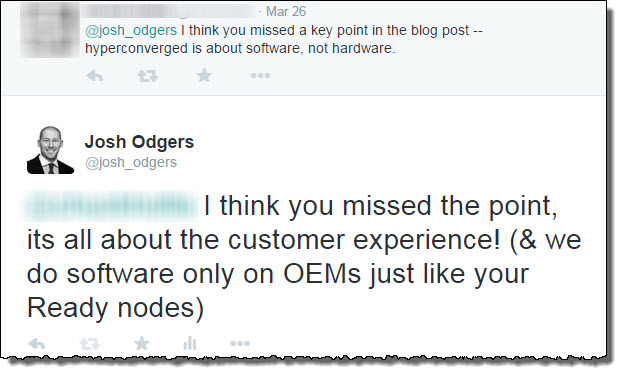
TweetAboutCustomerExperience

I agree doing things in software is a great idea, and that is what Nutanix and VSAN do, provide a solution in software which combines with commodity hardware to create a Hyper-converged solution.

Summary:

A great customer experience (which is what I believe matters) along with high performance (1M+ IOPS) solution can be delivered both In-Kernel or via a VSA, it’s simple as that. We are long past the days where a VM was a significant bottleneck (circa 2004 w/ ESX 2.x).

I’m glad VMware has led the market in pushing customers to virtualize Business Critical Apps, because it works really really well and delivers lots of value to customers.

As a result of countless best practice guides, white papers, case studies from VMware and VMware Storage Partners such as Nutanix, we know highly compute / network & storage intensive applications can easily be virtualized, so anyone saying a Virtual Storage Appliance can’t (or shouldn’t) be, simply doesn’t understand how efficient the ESXi hypervisor is and/or he/she hasn’t had the industry experience deploying storage intensive Business Critical Applications.

To all Hyper-converged vendors: Can we stop this ridiculous debate and get on with the business of delivering a great customer experience and focus on the business at hand of taking down traditional SAN/NAS? I don’t know about you, but that’s what I’ll be doing.

Calculating Actual Usable capacity? It’s not as simple as you might think! – Part 1 SAN/NAS

Calculating the usable capacity for your next SAN/NAS is easy. Work out the number of drives you have, what RAID config your going to use and your done, right?!

Wrong! There are numerous factors which come into play to understand the ACTUAL or TRUE usable capacity of a SAN/NAS solution.

So let’s take an example of a traditional SAN/NAS using RAID and work out how much space we can actually use.

Note this is a simplified and generic example, which will vary from vendor to vendor.

Let’s say a SAN/NAS has 100 x 1TB drives (Note: The type of drive is not important for this example) and has the requirement to support mixed workloads such as MS SQL , MS Exchange and general server workloads.

As per vendor best practices, RAID 10 is used to maximize IOPS for SQL / Oracle and other storage intensive applications, RAID 5 is used for things like MS Exchange and RAID 6 (or DP) is used for general server workloads.

The vendor also recommends one hot spare drive per 2 disk shelves to ensure when drives fail, there are sufficient hot spares available.

So let’s start with 100TB RAW and see where things end up.

1. Deducting hot spare drives

So assuming 14 drives per shelf, that’s 7 drives (or 7TB RAW) dedicated to hot spares.

100TB – 7TB = 93TB

2. RAID Overhead

Let’s assume 20% of our workloads require RAID 10, so 20 drives are used. RAID 10 has a usable capacity of 50% so 20TB – 50% = 10TB

Next let’s say 40% of our workloads use RAID 5, so 40 drives broken up into 5 x RAID 5s each with 8 drives in a 7+1 Parity configuration. Therefore with 5 x RAID 5s volumes we loose 5 drives (5TB RAW) worth of capacity.

The final 40% of our workloads use RAID6 (or DP), so 40 drives broken up into 5 x RAID 6s each with 8 drives in a 6+2 Parity configuration therefore with 5 x RAID 6s we loose 10 drives (10TB RAW) worth of capacity.

93TB – 10TB (RAID 10) – 5TB (RAID5) – 10TB (RAID6) = 68TB remaining

3. Free Space on the platform required to ensure performance

For most traditional storage solutions, the vendors recommend ensuring a specific percentage of free space to ensure performance remains consistent.

For some vendors this is 20% and others say around 30%.

For this example, I will assume best case scenario of 20%.

68TB – 20% (Free space for performance) = 54.4TB

4. Free space per LUN

Vendors typically recommend having between 10-20% free space per LUN to account for unexpected growth, VM level snapshots etc. This makes perfect sense as if a LUN runs out of space, its a bad day for the I.T dept.

For this example, I will assume only 10% free space per LUN but it could easily be 20% further reducing usable capacity.

54.4TB – 10% (Free space per LUN) = 48.96TB

5. Free space per VMDK

As with physical servers, we don’t want our VMs drives running out of capacity, as a result it is common to size VMDKs well above what is strictly required to make capacity management (operational tasks) easier.

I typically see architects recommending upwards of 10-20% free space per VMDK over and above what is required to account for unexpected growth, OS patching etc. This makes perfect sense for the same reason as we have free space per LUN because if space runs out for a VM, it’s another bad day for I.T.

For this example, I will assume only 10% free space per VMDK.

48.96TB – 10% (Free space per VMDK) = 44.064TB

Now where are we at?

So far, the first 5 points are fairly easy to calculate and if you agree or not with the specific examples or percentage deductions, I’d suggest few would disagree these are factors which reduce usable disk space for traditional SAN/NAS deployments.

Next we will look at various factors which further reduce usable capacity. Each of these factors will vary from customer to customer, which further complicates the sizing exersize and results in lower usable capacity than what you may believe.

6. Silos for Performance

In this example, we have assumed only 20% of our drives are configured for high I/O with RAID 10, but in many cases the drives required for performance could be a much higher percentage.

Now to get the IOPS required for these storage intensive applications, its common to see the capacity utilization of the LUNs be much lower than the usable capacity because the storage is IOPS constrained, not capacity.

This leads to Silos of drives with low utilization, where the remaining capacity cannot (or at least should not) be shared with other VMs as this would likely impact the performance of the IO intensive VMs.

So for example, if our RAID 10 LUNs have 50% free space (which I personally have found to be common) then we’re effectively wasting 5TB (50% of the RAID 10s 10TB usable).

44.064TB – 10% (Wasted Capacity for Performance Silos) = 39.65TB

7. Silos of (or Fragmented) Usable Capacity

In this example, we have assumed 40% of our drives are configured for RAID 5 and the remaining 40% for RAID 6 (DP) to suit the different workloads in this environment, as a result we have 2 “Silos” of usable capacity.

In this post I have described 5 x 8 drive RAID 5s and 5 x 8 Drive RAID 6 volumes. The below diagram is an example of what an environment in this configuration may have with regards to free space per LUN.

LUNsFreeSpace

So we can see the average free space per LUN is 20%, but it varies from one LUN having only 5% free space and another having 35%.

In this case, when creating a new VM, or adding or expanding VMDKs for existing VMs, we have a situation where we will need to be careful about where we place a new VMDK from a capacity perspective but keeping in mind performance as well.

Now not all VMs or VMDKs are the same size, so if a new VMDK needs to be 500GB even though the environment may have well in excess of 500GB available, the fact that the free space is fragmented across multiple LUNs means we cannot create the new VMDK without first migrating VMs across the LUNs.

Now Storage DRS can do a reasonable job of this, but that takes time and impacts performance (during the Storage vMotion) and depending on the size of the VMs in the environment may not always be able to solve the issue.

Best case scenario, in my experience is at least 10% of capacity is wasted simply because of the fact the drives are carved up into RAID groups and VMs don’t fit within the inflexible LUNs.

39.65TB – 10% (Wasted Capacity due to de-fragmented free space) = 35.68TB

Usable space so far from 100TB RAW is only 35.68TB or approx 1/3rd!

Other factors which reduce usable capacity?

8. LUN Provisioning Type

In many cases, especially when talking about high performance applications, storage vendors recommend using Thick Provisioned LUNs.

As a result limited or no overcommitment can be achieved which reduces the usable capacity due to the thick provisioning.

It’s anyone’s guess how much space is wasted as a result.

Summary:

From the 100TB RAW factoring in what I believe to be realistic configuration of RAID, the impact of free space requirements, thick provisioning and capacity fragmentation we end up with only 35.68TB usable capacity or approx 1/3rd of the RAW.

Now most vendors provide some form of data reduction such as compression/de-duplication, others recommend some thin provisioning and these may increase the effective capacity, but this example shows its not as simple as you think to size for SAN/NAS storage and the overhead of RAID is only one of the many factors which impact the effective usable capacity.

In Part 2, I will run through a similar example for Nutanix usable capacity.

How to successfully Virtualize MS Exchange – Part 17 – Virtual Machine Storage Configuration

In addition to Part 16 where we discussed Virtual Disk Provisioning options and recommendations, In this part we will cover how to optimally configure a Virtual Machine for an Exchange MBX/MSR workload from a virtual storage controller perspective.

Once you have made the decision on storage platform, and assuming you have chosen to use VMFS or NFS datastores (and not iSCSI in-Guest or RDMs), then this article is for you.

Virtual Machines just like physical servers, have SCSI controllers (albeit virtual) and ESXi has a number of options to choose from which include:

1. BusLogic Parallel
2. LSI Logic Parallel
3. LSI Logic SAS
4. Paravirtual SCSI (PVSCSI)
5. AHCI SATA Controller

By default when creating a new virtual machine the default adapter for Windows 2008 and 2012 is “LSI Logic SAS” because Windows does not have the PVSCSI driver by default.

BusLogic ParallelLSI Logic Parallel adapters are not recommended for Windows 2008/2012 as they are legacy controllers with lower performance, as such I will not cover these in any more detail as they are irrelevant to Exchange deployments.

Instead I will cover the LSI Logic SASAHCI SATA Controller and Paravirtual SCSI (PVSCSI) adapters.

Starting with LSI Logic SAS,

This is the default controller for Windows 2008/2012 VMs, as a result, it is very common to see Exchange deployments using this controller. It has good performance and works out of the box with a Windows install without requiring drivers.

Advantages:

1. The default Controller for Windows 2008/2012
2. No need for manually inserting drivers to install Windows
3. Higher performance than AHCI SATA controller

Disadvantages:

1. Lower performance than PVSCSI
2. Higher CPU overheads in Guest compared to PVSCSI
3. Higher latency than PVSCSI
4. Lower maximum number of VMDKs supported per controller (15) compared to AHCI SATA (30)

Next let’s discuss the AHCI SATA Controller.

The AHCI SATA controller is new in vSphere 5.5 and is only supported in Virtual Machines with Hardware version 10. The SATA controller can be used on its own or in addition to LSI or PVSCSI controllers to provide additional VMDKs / Capacity which increases a single VMs maximum capacity from ~3.7PB to over 11PB.

Advantages:

1. Can support 30 VMDKs per Controller (120 total) compared to 15 for LSI / PVSCSI
2. Can be used in addition to PVSCSI controllers to provide more storage performance and capacity per Exchange VM (if required)
3. High capacity supported per controller than LSI Logic / PVSCSI

Disadvantages:

1. Higher CPU utilization per IO compared to LSI / PVSCSI options
2. Lower overall performance compared to LSI and PVSCSI
3. Higher latency compared to LSI and PVSCS

And Finally the Paravirtual SCSI Controller.

The PVSCSI controller is the highest performing controller and has been supported since ESXi 4.0 and are design for high performance storage environments and are available for virtual machines running hardware version 7 and later.

Advantages:

1. Performance , Performance , Performance. Oh yeah and did I mention performance?
2. Lower Latency and Higher IOPS compared to other controllers
3. Lower CPU overhead on the Guest OS (and therefore ESXi)
4. More CPU is available for Exchange due to lower CPU overheads

Disadvantages:

1. Windows Failover Clustering is not supported, but this has no impact on MS Exchange including DAG deployments.
2. PVSCSI is not the default and requires inserting drivers into the Windows installation OR the VM to be built on LSI Logic SAS and once VMware Tools is installed, swapping to PVSCSI.
3. Lower maximum VMDKs supported per controller (15) compared to AHCI SATA (30)

Performance Comparison

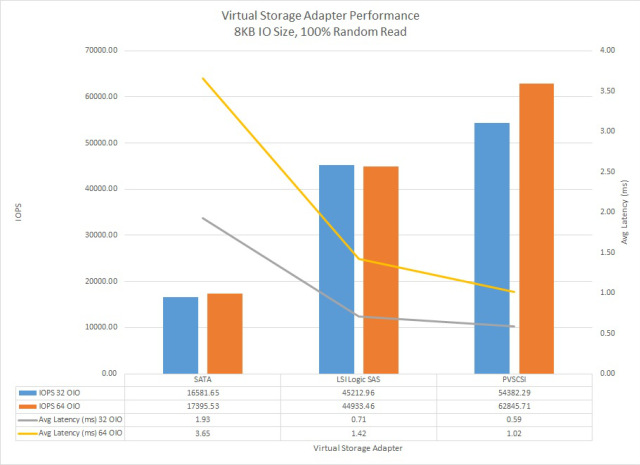
From a performance perspective, Michael Webster (VCDX#66) wrote this great post “VMware vSphere 5.5 Virtual Storage Adapter Performance” and produced the following graph showing a comparison between SATA, LSI Logic SAS and PVSCSI controllers from an IOPS, Latency perspective.

VMware-vSphere-5.5-Virtual-Storage-Adapter-Performance

As we can see, the PVSCSI adapter has significantly lower latency and higher IOPS than the SATA and LSILogic SAS controllers even when running on the same underlying storage.

While the Microsoft Exchange team have managed to successfully reduce I/O throughout the versions (2007-2013) the performance advantages also have a positive benefit on vCPU utilization.

Michael’s post states:

It (PVSCSI Controller) also had the lowest CPU usage. During the 32 OIO test SATA showed 52% CPU utilization vs 45% for LSI Logic SAS and 33% for PVSCSI.

What this means is less CPU utilization is used for I/O and lower average latency means more CPU is available for MS Exchange along with less CPU WAIT time (where the CPU is waiting for IO to complete before continuing). This means your onto a winner especially considering Exchange 2013 is very CPU intensive.

Which Controller should be used for Exchange VMs?

VMware have published the KB article “Do I choose the PVSCSI or LSI Logic virtual adapter on ESX\ESXi 4.0 for non-IO intensive workloads? (1017652)” which in summary explains:

The test results show that PVSCSI is better than LSI Logic, except under one condition–the virtual machine is performing less than 2,000 IOPS and issuing greater than 4 outstanding I/Os. This issue is fixed in vSphere 4.1 and later version, so that the PVSCSI virtual adapter can be used with good performance, even under this condition.


As the one caveat prior to vSphere 4.1 where LSI Logic can outperform PVSCSI, there are no significant downsides to using the PVSCSI compared to LSI as such, I recommend always using (multiple) PVSCSI adapters.

Now that we have decided on the PVSCSI adapter, what’s next?

As with physical servers, Virtual SCSI controllers including PVSCSI have their limits in terms of performance and scalability. To ensure maximum scalability, performance and low latency, multiple PVSCSI adapters should be used with all VMDKs evenly spread over the PVSCSI adapters as recommended in Part 11.

To do this, when adding a VMDK to the Exchange VM, ensure you select a different SCSI controller (which are created automatically on demand) by using the drop down box “Virtual Device Node” and selecting for example SCSI (1:0) as shown below.

MSRVMPVSCSI10

For subsequent VMDKs you must then select SCSI (2:0) as shown below.

MSRVMPVSCSI20

And then SCSI (3:0)

MSRVMPVSCSI30

For the forth VMDK, you then select SCSI (0:1) because SCSI (0:0) is taken by the VMDK used for the guest OS.

MSRVMPVSCSI01

Repeat the above process until you have sufficient VMDKs for your Exchange server VM.

The following illustrates my recommended configuration showing how to configure a VM supporting 8 database drives and 8 log drives.PVSCSIVMDKs

The above configuration will ensure maximum storage performance and can be expanded in the same configuration to support more than 3 times the number of databases + logs shown above and as such it is suitable for even very large (scale-up) Exchange MBX/MSR VMs.

For example, if each VMDK in the above configuration was just 4TB in size it would give you 64TB usable capacity and the VM can be scaled more than 3x the number of VMDKs.

Note: VMDKs can scale to 62TB (from vSphere 5.5) each although this may result in reduced performance.

TIP: Don’t forget to spread VMDKs evenly across datastores as per the recommendation in Part 11.

Recommendations for Exchange VM Storage Configuration:

1. Use multiple Paravirtual SCSI (PVSCSI) Adapters.
2. Use one VMDK per Database or Logs
3. Spread VMDKs evenly across multiple PVSCSI adapters
4. Spread VMDKs evenly across multiple datastores when using VMFS datastores
5. Spread VMDKs evenly across multiple datastores when using NFS datastores ensuring NFS datastores are served via multiple NAS controllers
6. Use more VMDKs as opposed to fewer larger VMDKs
7. Format NTFS volumes with an Allocation Unit Size of 64k
8. Keep it simple, do not mix virtual SCSI controller types.

Back to the Index of How to successfully Virtualize MS Exchange.