Dare2Compare Part 6 : Nutanix data efficiency stats can’t be found

If you’ve not read Parts 1 through 5, we have already proven several claims by HPE Simplivity regarding Nutanix to be false, as well as explored the misleading way in which HPE SVT promote data efficiency.

We continue with Part 6 where we will discuss HPE’s claim that “Nutanix data efficiency stats are stealthier than a ninja”. (below)

While HPE’s claim is an attempt to create Fear, Uncertainty and Doubt (FUD), HPE are partially correct in that we (Nutanix) have done a very poor job of promoting the arguably market leading data efficiency that Nutanix provides.

In fact, several colleagues and I created a feature request to properly report in a clear and detailed way, the ADSF data efficiencies and I am pleased to say these changes were included as part of the recent AOS 5.1 release.

Now what Nutanix users see in PRISM “Storage” view is (as shown below):

  1. A Capacity optimization overview
  2. Data reduction ratio which is made up of deduplication, compression and erasure coding savings*.
  3. Data reduction savings which is a total GB/TB/PB value from data reduction
  4. An Overall Efficiency ratio which is a combination of Data Reduction, Cloning and Thin Provisioning

*Metadata copies/snapshops/pointers etc are not included in the deduplication value as they are not deduplication.

The resulting summary is very clear and easy to understand so customers can see what efficiencies are from data reduction, and which savings (which typically form by far the largest “efficiency”) come from Cloning and thin provisioning.

DataReductionSummary2

One major item which will be included in an upcoming release is zero suppression. Zero suppression is a capability which has been in Nutanix Distributed Storage Fabric since Day 1 and it avoids unnecessarily storing zeros, instead storing metadata which achieves the same outcome but is much higher performance and uses much less capacity.

Nutanix snapshots or pointer based copies (depending on how you refer to them) are also not included in the overall efficiency number, however these will also be included as a seperate line item in a future release as we aim to be very clear regarding what data efficiencies a customer is achieving with Nutanix.

Some vendors recommend Eager Zero Thick (EZT) VMDKs on vSphere, and then deduplicate the zeros which artificially increases the deduplication ratio. Nutanix does not do this as it’s inefficient to create more data to deduplicate when you can simply avoid writing the data in the first place. However we do plan to report the savings from Zero suppression as a seperate line item as it is a value our platform provides.

For a more detailed view, Nutanix customers can dive down into the storage,Diagram view where admins can view of each containers data efficiency breakdown (as shown below).

DetailedContainerView

As we can see, Nutanix is very transparent showing what data reduction features are enabled, what ratio is being achieved, the total, used, reserved and even Thick Provisioned storage with an effective free based on physical multiplied by data reduction ratio and an overall efficiency value.

Now that we’ve covered off how Nutanix measures and reports on data reduction/efficiency, I’d like to highlight a critical factor when discussing data reduction/efficiency and that is that data efficiency is totally dependant on the individual customers data. For the same dataset, the difference between vendors with the same capabilities, e.g.: Deduplication, Compression and Erasure Coding (EC-X) are unlikely to be vastly different (or better put, change a business outcome one way or another) despite what each vendor will say about their implementation of such technologies.

In short: The biggest factor in the achieved data reduction is not the vendor, it’s the customer data.

With that said, if you’re comparing HPE SVT and Nutanix, then there is a pretty major delta between the two products in terms of capabilities and that is because Nutanix supports Erasure Coding (EC-X) and HPE SVT does not.

As a result, Nutanix has a major advantage as Erasure Coding in the Nutanix Acropolis Distributed Storage Fabric (ADSF) is complimentory to both deduplication and compression.

Unlike Compression and Deduplication, Erasure Coding can provide savings (or another way to look at it would be lower data redundancy overheads) regardless of the data type.

So where Deduplication and Compression will get minimal/no savings for data such as Video files, Erasure Coding still provides savings so the delta between Nutanix and HPE SVT will only increase in Nutanix favour the less the customer data will dedupe and/or compress.

HPE SVT on the other hand has a RAID (RAID 6 being N-2 usable or RAID 60 being N-4 usable) overhead and on top of that, use replication (2 copies / 50% usable) for an usable capacity (of raw) of well below 50% depending on the number of drives per node.

Nutanix, using RF2 and EC-X provides between 50% (minimum) and 80% (maximum) usable capacity of RAW and with RF3 (N+2) between 33% (minimum) and 66% (maximum) usable excluding the benefits of compression and deduplication.

The next major factor in data efficiency ratios is how they are measured!

In Part 1 I have already covered how misleading HPE SVT’s 10:1 efficiency guarantee is, and this is a great example of why it can be difficult to compare apples/apples between vendors. Nutanix on the other hand does not measure data efficiency in the same misleading manner.

In Summary:

  1. Nutanix AOS 5.1 has comprehensive data reduction/efficiency reporting within the PRISM HTML GUI
  2. Nutanix data reduction capabilities exceed that of HPE SVT as both products have Dedupe and Compression, but Erasure Coding (EC-X) is only supported on Nutanix
  3. All data reduction capabilities on Nutanix are complimentory, so Dedupe , Compression and Erasure Coding can all work together to maximise savings.
  4. Erasure Coding provides data reduction even for data which is not compressible or dedupeable
  5. Nutanix data efficiency stats are easily visible in the PRISM GUI and are much more detailed than HPE SVT

Return to the Dare2Compare Index:

But wait, there’s more!

As far as data reduction results are concerned, they are all over twitter and a simple search comes up with many examples. The first one being my favorite. Not because of the data reduction ratio itself but because it shows one of the major values of a 100% software solution where a simple software upgrade (which is one-click rolling, non-disruptive) provided the customer a significantly higher data reduction ratio. So basically, the customer got more capacity for free!

Note: None of the below show the latest data efficiency reporting capabilities from AOS 5.1.

Here are a few other examples which I found using this Twitter search:

NOS 4.5 Delivers Increased effective SSD tier capacity

In addition to the increased effective SSD (and SATA) tier capacity gained by using Erasure Coding (EC-X) which was announced at the Nutanix .NEXT conference earlier this year, the upcoming NOS (Nutanix Operating System) 4.5 is providing a yet another effective capacity increase for the SSD tier.

Here’s how it works:

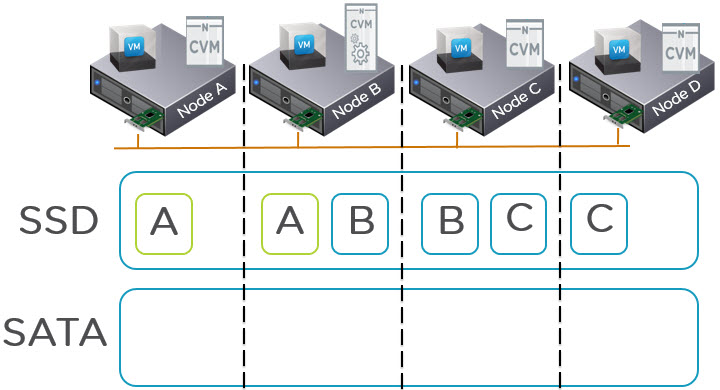
The below 4 node cluster has 3 VMs actively using data (known as extents) represented by the A,B,C blocks. This is a very simplified example as VMs will have potentially hundreds or thousands of extents distributed throughout a cluster.

AllHotDataSSD

What we can see in the above diagram is two copies of each piece of data as this is an RF2 deployment. The VM on Node A is using extent A, the VM on Node B is using extent B and the VM on Node C is using extent C.

Because the VMs are using Extents A,B and C, they all remain within the SSD tier including the replicas distributed throughout the cluster. When these extents become cold they will be dynamically moved to the SATA tier.

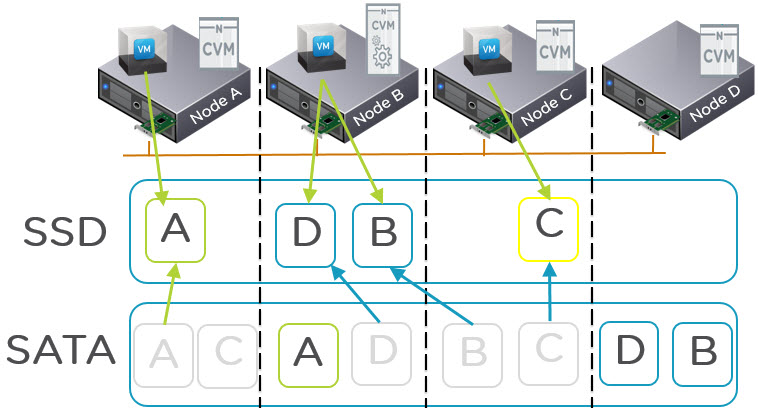
What is changing in NOS 4.5 is the Nutanix tiering solution called ILM (Intelligent Lifecycle Management) now perform up-migrations (from SATA to SSD) on a per extent basis which means replicas are treated independent of each other. What this means is the hot extents will up-migrate to SSD on the node where the VM is running (via Data Locality) giving all flash performance while the replicas distributed throughout the cluster will remain in the SATA tier as shown below:

PerExtentUpMigrations

As we can see in the above diagram, all copies of A,B,C and D were in the SATA tier. Then the VM on node A started frequently reading from data A and the local extent is therefore up-migrate to SSD.

For the VM on node B, it started frequently accessing data D and B. Data D was up-migrated from local SATA and data B was up-migrated AND localized as it was residing on a remote node. The VM on node C also up-migrated from local SATA the same as VM on node A.

Now we can see that out of the 8 extents, we have 4 which have me up-migrated and localized (where required) and 4 which remain in the low cost SATA tier.

As a result the SSD tiers effective capacity is doubled for RF2 and tripled for RF3. So this means for customers using RF2, the active working set can potentially double while still providing all flash performance.

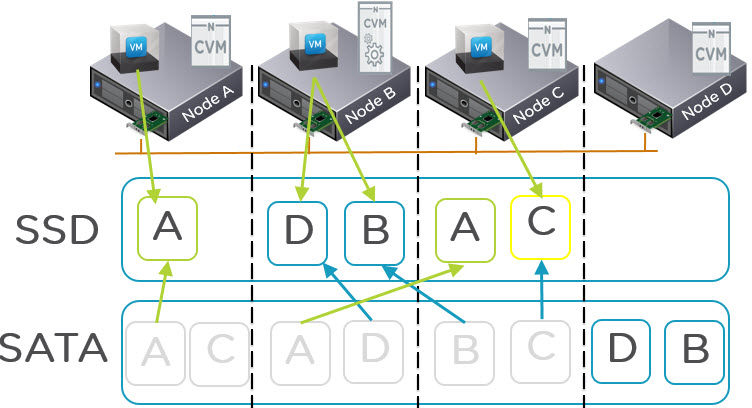
If data is frequently being overwritten NDFS will detect this and up-migrate both the local and remote copy/copies to ensure write I/O is always serviced by the SSD tier. The below diagram shows Data A being up-migrated to node C SSD tier ready to service the redundant replicas for any write I/O.

PerExtentUpMigrationsWriteIO

As typical mixed workload environments have a higher Read vs Write ratio e.g.: 70/30 the benefits of only up-migrating one extent when it becomes hot is effective for a large percentage of the I/O.

Even in the event the Read vs Write Ratio is reversed e.g.: 30/70 which is typical for VDI environments, the new ILM process will still provide a significant effective increase of the SSD tier by only up-migrating one out of two extents. It should be noted for VDI solutions, VAAI-NAS already provides huge data reduction savings thanks to intelligent cloning and as a result it is not uncommon to find large VDI deployments on Nutanix using only the SSD tier.

Summary:

NOS 4.5 delivers Double or Triple (for RF3) the effective SSD tier capacity in addition to data reduction savings from technologies such as deduplication, compression and Erasure Coding (EC-X). This feature is like most things with Nutanix is hypervisor agnostic!

Not bad for a free software upgrade huh!

Related Posts:

1. Scaling Hyper-converged solutions – Compute only.

2. Advanced Storage Performance Monitoring with Nutanix

3. Nutanix – Improving Resiliency of Large Clusters with Erasure Coding (EC-X)

4. Nutanix – Erasure Coding (EC-X) Deep Dive

5. Acropolis: VM High Availability (HA)

6. Acropolis: Scalability

7. NOS & Hypervisor Upgrade Resiliency in PRISM

Calculating Actual Usable capacity? It’s not as simple as you might think! – Part 1 SAN/NAS

Calculating the usable capacity for your next SAN/NAS is easy. Work out the number of drives you have, what RAID config your going to use and your done, right?!

Wrong! There are numerous factors which come into play to understand the ACTUAL or TRUE usable capacity of a SAN/NAS solution.

So let’s take an example of a traditional SAN/NAS using RAID and work out how much space we can actually use.

Note this is a simplified and generic example, which will vary from vendor to vendor.

Let’s say a SAN/NAS has 100 x 1TB drives (Note: The type of drive is not important for this example) and has the requirement to support mixed workloads such as MS SQL , MS Exchange and general server workloads.

As per vendor best practices, RAID 10 is used to maximize IOPS for SQL / Oracle and other storage intensive applications, RAID 5 is used for things like MS Exchange and RAID 6 (or DP) is used for general server workloads.

The vendor also recommends one hot spare drive per 2 disk shelves to ensure when drives fail, there are sufficient hot spares available.

So let’s start with 100TB RAW and see where things end up.

1. Deducting hot spare drives

So assuming 14 drives per shelf, that’s 7 drives (or 7TB RAW) dedicated to hot spares.

100TB – 7TB = 93TB

2. RAID Overhead

Let’s assume 20% of our workloads require RAID 10, so 20 drives are used. RAID 10 has a usable capacity of 50% so 20TB – 50% = 10TB

Next let’s say 40% of our workloads use RAID 5, so 40 drives broken up into 5 x RAID 5s each with 8 drives in a 7+1 Parity configuration. Therefore with 5 x RAID 5s volumes we loose 5 drives (5TB RAW) worth of capacity.

The final 40% of our workloads use RAID6 (or DP), so 40 drives broken up into 5 x RAID 6s each with 8 drives in a 6+2 Parity configuration therefore with 5 x RAID 6s we loose 10 drives (10TB RAW) worth of capacity.

93TB – 10TB (RAID 10) – 5TB (RAID5) – 10TB (RAID6) = 68TB remaining

3. Free Space on the platform required to ensure performance

For most traditional storage solutions, the vendors recommend ensuring a specific percentage of free space to ensure performance remains consistent.

For some vendors this is 20% and others say around 30%.

For this example, I will assume best case scenario of 20%.

68TB – 20% (Free space for performance) = 54.4TB

4. Free space per LUN

Vendors typically recommend having between 10-20% free space per LUN to account for unexpected growth, VM level snapshots etc. This makes perfect sense as if a LUN runs out of space, its a bad day for the I.T dept.

For this example, I will assume only 10% free space per LUN but it could easily be 20% further reducing usable capacity.

54.4TB – 10% (Free space per LUN) = 48.96TB

5. Free space per VMDK

As with physical servers, we don’t want our VMs drives running out of capacity, as a result it is common to size VMDKs well above what is strictly required to make capacity management (operational tasks) easier.

I typically see architects recommending upwards of 10-20% free space per VMDK over and above what is required to account for unexpected growth, OS patching etc. This makes perfect sense for the same reason as we have free space per LUN because if space runs out for a VM, it’s another bad day for I.T.

For this example, I will assume only 10% free space per VMDK.

48.96TB – 10% (Free space per VMDK) = 44.064TB

Now where are we at?

So far, the first 5 points are fairly easy to calculate and if you agree or not with the specific examples or percentage deductions, I’d suggest few would disagree these are factors which reduce usable disk space for traditional SAN/NAS deployments.

Next we will look at various factors which further reduce usable capacity. Each of these factors will vary from customer to customer, which further complicates the sizing exersize and results in lower usable capacity than what you may believe.

6. Silos for Performance

In this example, we have assumed only 20% of our drives are configured for high I/O with RAID 10, but in many cases the drives required for performance could be a much higher percentage.

Now to get the IOPS required for these storage intensive applications, its common to see the capacity utilization of the LUNs be much lower than the usable capacity because the storage is IOPS constrained, not capacity.

This leads to Silos of drives with low utilization, where the remaining capacity cannot (or at least should not) be shared with other VMs as this would likely impact the performance of the IO intensive VMs.

So for example, if our RAID 10 LUNs have 50% free space (which I personally have found to be common) then we’re effectively wasting 5TB (50% of the RAID 10s 10TB usable).

44.064TB – 10% (Wasted Capacity for Performance Silos) = 39.65TB

7. Silos of (or Fragmented) Usable Capacity

In this example, we have assumed 40% of our drives are configured for RAID 5 and the remaining 40% for RAID 6 (DP) to suit the different workloads in this environment, as a result we have 2 “Silos” of usable capacity.

In this post I have described 5 x 8 drive RAID 5s and 5 x 8 Drive RAID 6 volumes. The below diagram is an example of what an environment in this configuration may have with regards to free space per LUN.

LUNsFreeSpace

So we can see the average free space per LUN is 20%, but it varies from one LUN having only 5% free space and another having 35%.

In this case, when creating a new VM, or adding or expanding VMDKs for existing VMs, we have a situation where we will need to be careful about where we place a new VMDK from a capacity perspective but keeping in mind performance as well.

Now not all VMs or VMDKs are the same size, so if a new VMDK needs to be 500GB even though the environment may have well in excess of 500GB available, the fact that the free space is fragmented across multiple LUNs means we cannot create the new VMDK without first migrating VMs across the LUNs.

Now Storage DRS can do a reasonable job of this, but that takes time and impacts performance (during the Storage vMotion) and depending on the size of the VMs in the environment may not always be able to solve the issue.

Best case scenario, in my experience is at least 10% of capacity is wasted simply because of the fact the drives are carved up into RAID groups and VMs don’t fit within the inflexible LUNs.

39.65TB – 10% (Wasted Capacity due to de-fragmented free space) = 35.68TB

Usable space so far from 100TB RAW is only 35.68TB or approx 1/3rd!

Other factors which reduce usable capacity?

8. LUN Provisioning Type

In many cases, especially when talking about high performance applications, storage vendors recommend using Thick Provisioned LUNs.

As a result limited or no overcommitment can be achieved which reduces the usable capacity due to the thick provisioning.

It’s anyone’s guess how much space is wasted as a result.

Summary:

From the 100TB RAW factoring in what I believe to be realistic configuration of RAID, the impact of free space requirements, thick provisioning and capacity fragmentation we end up with only 35.68TB usable capacity or approx 1/3rd of the RAW.

Now most vendors provide some form of data reduction such as compression/de-duplication, others recommend some thin provisioning and these may increase the effective capacity, but this example shows its not as simple as you think to size for SAN/NAS storage and the overhead of RAID is only one of the many factors which impact the effective usable capacity.

In Part 2, I will run through a similar example for Nutanix usable capacity.