How to view a VMs Active Working Set in PRISM

Knowing a Virtual Machines Active Working Set is critical to ensuring all flash performance in any hybrid storage solution (Flash + SAS or SATA).

Because this is so critical, Nutanix has tracked this information for a long time via the hidden 2009 page. However as this information being available has proven to be so popular, it was included in PRISM in the latest release of Nutanix Acropolis Base Version 4.5.

The working set size for a virtual machines active working set can be viewed on a per vdisk basis across all supported hypervisors including ESXi, Hyper-V, KVM and the Acropolis Hypervisor (AHV).

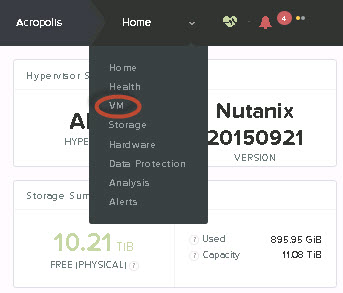
To view this information, from the “Home” screen of PRISM, select the “VM” as shown below:

Note: The following screen shots were taken from an environment running Acropolis Base Version 4.5 and Acropolis Hypervisor 20150921 but the same process is applicable to any hypervisor.

PRISMVMmenu

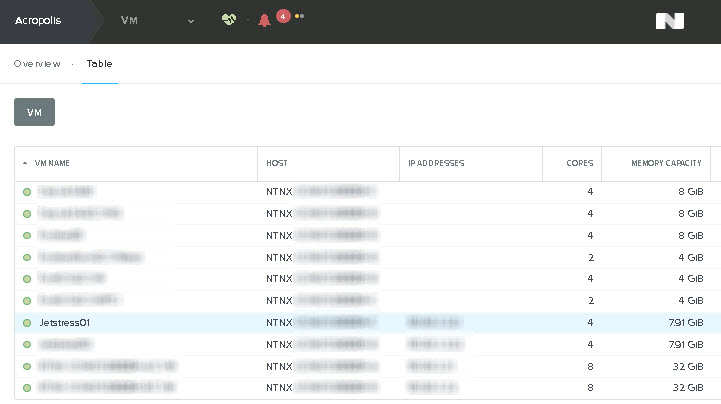
Next highlight the Virtual Machine you wish to view details on, In the example below VM “Jetstress01” has been highlighted.VMlist
Below the above section you will see the VM summary as shown below. To view the working set size, Select “Virtual Disks” then the “Additional Stats” option which will show the following display:WorkingSetSizeAdditionalDetailsAs we can see the following information is displayed on a per vdisk granularity:

  1. Read / Write Latency
  2. Total IOPS
  3. Random IO percentage
  4. Read Throughput from Extent Cache / SSD and HDD
  5. Read Working set size
  6. Write Working set size
  7. Union Working set size

With the above information it is easy to calculate what node type and SSD capacity is most suitable for the virtual machine. This is something I would recommend customers running business critical applications check out.

If the “Read Source HDD” is showing frequent throughput and performance is lower than desired, moving the VM to a node with a larger SSD capacity will help performance. Alternatively if there are no nodes with a larger SSD tier, enabling in-line compression and/or Erasure Coding can help increase the effective SSD tier capacity and allow a larger working set size to be served from SSD.

If compression and EC-X are enabled and the SSD tier is still insufficient, additional nodes with larger SSD tier can be non disruptively added to the cluster and the virtual machine/s migrated regardless of hypervisor.

Acropolis Base Version 4.5 adds a lot of enhancements such as this so I recommend customers perform the one click upgrade and start exploring and utilizing this additional information.

Acropolis Hypervisor (AHV) & non-uniform node CPU generations

For those of you familiar with VMware vSphere’s Enhanced vMotion Compatibility (EVC) feature, you might be wondering how non-uniform CPU generations are handled in an Acropolis Hypervisor (AHV) environment.

Well, as with most things Nutanix, the answer is simple.

NOS 4.5 automatically detects and configures the lowest common CPU generation as the baseline on a per cluster basis.

The following diagram shows how it works:

AHVEVC2

As we can see, we have a four node Acropolis cluster with 3 different CPU generations. Acropolis detects Sandy Bridge as the lowest common denominator and ensures VMs on all nodes are only exposed the Sandy Bridge CPU capabilities.

This ensures Live migration capabilities are maintained across the cluster.

Note: As with vSphere’s EVC, VMs still benefit from higher clock rates and performance from newer generation CPUs, they just don’t have all CPU capabilities exposed, so don’t be fooled into thinking your newer/faster CPUs are wasted in a mixed environment.

NOS 4.5 Delivers Increased effective SSD tier capacity

In addition to the increased effective SSD (and SATA) tier capacity gained by using Erasure Coding (EC-X) which was announced at the Nutanix .NEXT conference earlier this year, the upcoming NOS (Nutanix Operating System) 4.5 is providing a yet another effective capacity increase for the SSD tier.

Here’s how it works:

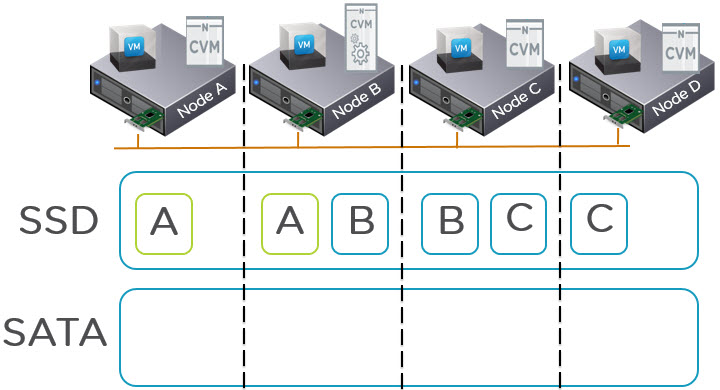
The below 4 node cluster has 3 VMs actively using data (known as extents) represented by the A,B,C blocks. This is a very simplified example as VMs will have potentially hundreds or thousands of extents distributed throughout a cluster.

AllHotDataSSD

What we can see in the above diagram is two copies of each piece of data as this is an RF2 deployment. The VM on Node A is using extent A, the VM on Node B is using extent B and the VM on Node C is using extent C.

Because the VMs are using Extents A,B and C, they all remain within the SSD tier including the replicas distributed throughout the cluster. When these extents become cold they will be dynamically moved to the SATA tier.

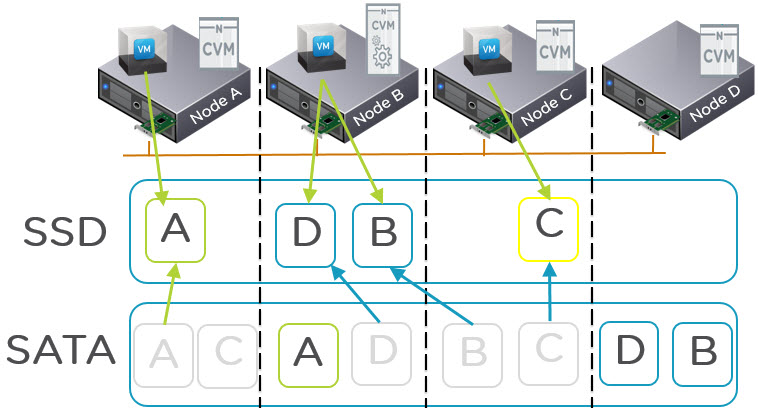
What is changing in NOS 4.5 is the Nutanix tiering solution called ILM (Intelligent Lifecycle Management) now perform up-migrations (from SATA to SSD) on a per extent basis which means replicas are treated independent of each other. What this means is the hot extents will up-migrate to SSD on the node where the VM is running (via Data Locality) giving all flash performance while the replicas distributed throughout the cluster will remain in the SATA tier as shown below:

PerExtentUpMigrations

As we can see in the above diagram, all copies of A,B,C and D were in the SATA tier. Then the VM on node A started frequently reading from data A and the local extent is therefore up-migrate to SSD.

For the VM on node B, it started frequently accessing data D and B. Data D was up-migrated from local SATA and data B was up-migrated AND localized as it was residing on a remote node. The VM on node C also up-migrated from local SATA the same as VM on node A.

Now we can see that out of the 8 extents, we have 4 which have me up-migrated and localized (where required) and 4 which remain in the low cost SATA tier.

As a result the SSD tiers effective capacity is doubled for RF2 and tripled for RF3. So this means for customers using RF2, the active working set can potentially double while still providing all flash performance.

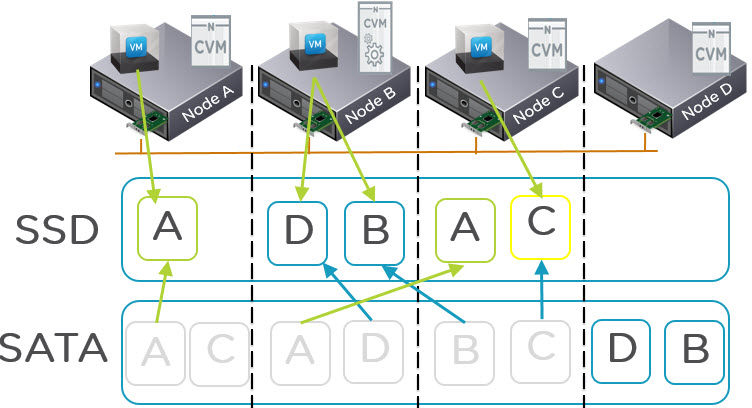
If data is frequently being overwritten NDFS will detect this and up-migrate both the local and remote copy/copies to ensure write I/O is always serviced by the SSD tier. The below diagram shows Data A being up-migrated to node C SSD tier ready to service the redundant replicas for any write I/O.

PerExtentUpMigrationsWriteIO

As typical mixed workload environments have a higher Read vs Write ratio e.g.: 70/30 the benefits of only up-migrating one extent when it becomes hot is effective for a large percentage of the I/O.

Even in the event the Read vs Write Ratio is reversed e.g.: 30/70 which is typical for VDI environments, the new ILM process will still provide a significant effective increase of the SSD tier by only up-migrating one out of two extents. It should be noted for VDI solutions, VAAI-NAS already provides huge data reduction savings thanks to intelligent cloning and as a result it is not uncommon to find large VDI deployments on Nutanix using only the SSD tier.

Summary:

NOS 4.5 delivers Double or Triple (for RF3) the effective SSD tier capacity in addition to data reduction savings from technologies such as deduplication, compression and Erasure Coding (EC-X). This feature is like most things with Nutanix is hypervisor agnostic!

Not bad for a free software upgrade huh!

Related Posts:

1. Scaling Hyper-converged solutions – Compute only.

2. Advanced Storage Performance Monitoring with Nutanix

3. Nutanix – Improving Resiliency of Large Clusters with Erasure Coding (EC-X)

4. Nutanix – Erasure Coding (EC-X) Deep Dive

5. Acropolis: VM High Availability (HA)

6. Acropolis: Scalability

7. NOS & Hypervisor Upgrade Resiliency in PRISM