Peak performance vs Real World – Exchange on Nutanix Acropolis Hypervisor (AHV)

I wrote a post in April 2015 titled “Peak Performance vs Real World Performance” which discusses how benchmarks are not realistic and the performance shown in benchmarks can rarely be reproduced with real workloads. It has been one of my most popular posts, and I have had overwhelmingly positive feedback, with only a select few still pushing unrealistic peak performance benchmarks as being of value to customers.

I thought I would whip up a post showing an example of benchmarks vs real world performance requirements using MS Exchange Jetstress on Nutanix.

The below is a screen shot from Nutanix PRISM HTML based GUI showing a Virtual Machines Read/Write IOPS , bandwidth and latency during a MS Exchange Jetstress benchmark.

JetstressAHV20160105

The screen shot shows ~4000 Read IOPS and ~4000 Write IOPS at a latency of 1.59ms.

But what does the above really tell us and what does it mean to a customer?

I’ve been quoted as saying “Benchmarks are of little value without context specific to customer requirements!” and I stand by this statement.

Let’s now look at an example of a real customers requirement:

The below is from the Exchange server role requirements calculator and it is a screen shot from the Role requirements tab which shows an estimate of the IOPS required for the Databases and Logs for a single Exchange instance.

ExchangeIOexample

It shows the required IOPS being 536 for the databases and 115 for the logs.

Note: The sizing calculator was for an environment supporting 20000 mailboxes across 3 mailbox servers. As such, the above IO requirements are for ~6666 users.

So now that we have done the MS Exchange solution sizing (shown above is just the storage performance requirements), we understand the requirement to be around 651 mixed Read/Write IOPS per mailbox VM. We can then take a benchmark such as Jetstress and validate that the solution has sufficient storage performance.

To require the ~8000 IOPS the Jetstress test showed, we would need to scale up each Exchange instances to support have a much larger number of users and have each user send/receive 500 emails per day to reach this requirement.

8kJetstressIOPS

But in scaling up each Exchange instance to reach the peak IOPS that even this 3 year old generation Nutanix node can deliver we would vastly exceed the compute sizing recommendations for Exchange 2013 (being 24vCPUs and 96GB RAM) as shown by the calculator below.

ScaleUpExchange

As we can see, for an Exchange instance to require those peak IOPS, we would have to size the Mailbox server VMs with more than 10x the recommended vCPUs (24) and 15x the RAM (96GB). This shows that peak IOPS which can be achieved are not relevant in the real world.

In fact, Exchange generally does not require more than 1000 IOPS. Typically its requires much less, as my earlier example shows. So peak performance numbers are of little/no value as they can’t (and more importantly don’t need to be) reproduced in the real world.

With a tool like Jetstress we can configure a precise Mailbox profiles and test only what you require. If the solution can produce more IOPS than what you need (such as in this example), that’s fine for headroom, but in this day and age where Nutanix allows you to quickly and easily scale (Compute/Storage performance & capacity), I recommend designing for what you need in the foreseeable future (by this I mean 6-12 months) and scale if/when required.

What a benchmark does help you understand is how much headroom a solution has over and above your requirements which can help choose a solution to support mixed workloads, BUT the benchmark would need to be re-ran concurrently with suitable benchmarks for all other applications you intend on mixing to see how the solution behaves with mixed workloads.

As such, single application peak performance benchmarks are almost never valuable (to customers) unless your planning to run application specific silos. I strongly recommend anyone considering implementing an application specific silo, read the following article: Enterprise Architecture & Avoiding tunnel vision.

And… if you’re planning to run application specific silos and/or scaling up workloads to the point they need crazy IOPS, then you’re increasing the size of your failure domains, CAPEX and OPEX which is only doing yourself (or your customer) a disservice. But that’s a topic for another day.

I hope this example shows how real world requirements and performance is vastly different to what a benchmark shows and why peak performance benchmarks should be taken with a grain of salt.

I’ve always said the focus should be on gathering requirements and delivering on business outcomes, not focusing on performance which is typically only a very small part of a solution that delivers a successful business outcome.

Summary:

When sizing an MS Exchange solution on Nutanix, IOPS is not a constraining factor even for large scale deployments. The most common constraining factor is the Microsoft recommended compute maximums being 24 vCPUs and 96GB RAM, which is the same constraint regardless of if you run on Nutanix, or any other virtual / physical platform.

Related Articles:

What if my VMs storage exceeds the capacity of a Nutanix node?

I get this question a lot, What if my VM exceeds the capacity of the node its running on. The answer is simple, the storage available to a VM is the entire storage pool which is made up of all nodes within the cluster and is not limited to the capacity of any single node.

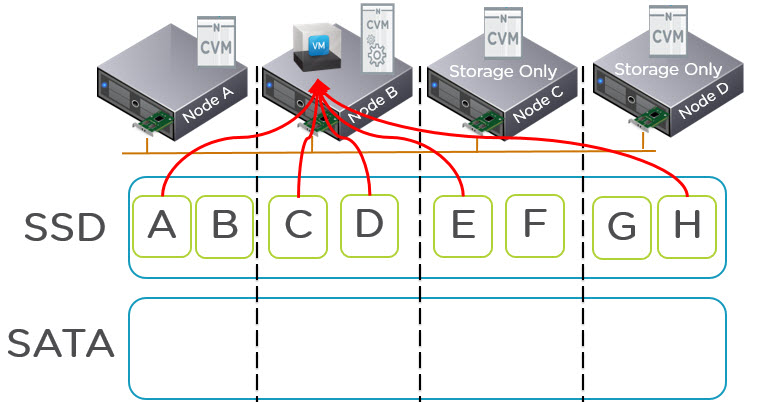
Let’s take an extreme example, a single VM is running on Node B (shown below) and all other nodes have no workloads. Regardless of if the nodes are “Storage only” such as NX-6035C or any Nutanix node capable of running VMs e.g.: NX3060-G4 the SSD and SATA tiers are shared.

AllSSDhybrid

The VM will write data to the SSD tier and only once the entire SSD tier (i.e.: All SSD in all nodes) reaches 75% capacity will ILM tier the coldest data off the to SATA tier. So if the SSD tier never reaches 75% you will have all data in SSD tier both local and remote.

This means multiple CVMs (Nutanix Controller VM) will service the I/O which allows for single VMs to achieve scale up type performance where required.

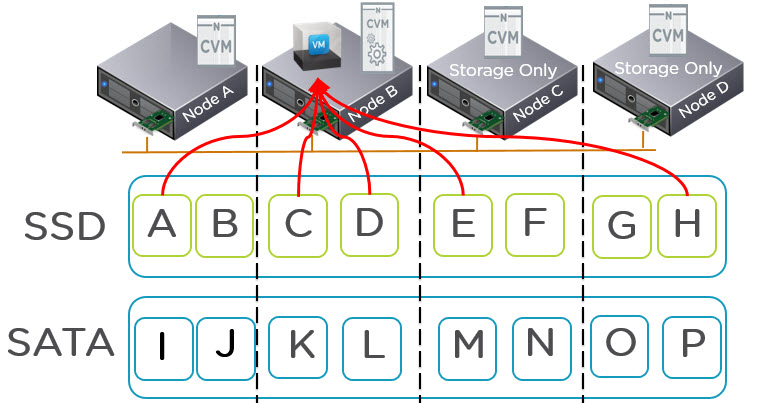
As the SSD tier exceeds 75% data is tiered down to SATA but active data will still reside in SSD tier across the cluster and be serviced with all flash performance.

The below shows there is a lot of data in the SATA tier but ILM is intelligent enough to ensure hot data remains in the SSD tier.

AllSSDwithColdData

Now what about Data Locality, Data Locality is maintained where possible to ensure the overheads of going across the network are minimized but simply put, if the active working set exceeds the local SSD tier Nutanix ensures maximum performance by distributing data across the shared SSD tier (not just two nodes for example) and services I/O through multiple controllers.

In the worst case where the active working set exceeds the local SSD capacity but fits within the shared SSD tier, you will have the same performance as a Centralised All Flash Array, in the best case, Data Locality will avoid the requirement to traverse the IP network and service reads locally.

If the active working set exceeds the shared SSD tier, Nutanix also distributes data across the shared SATA tier and services I/O from all nodes within the cluster as explained in a recent post “NOS 4.5 Delivers Increased Read Performance from SATA“.

Ideally I recommend sizing the Active working set of VMs to fit within the local SSD tier but this is not always possible. If you’re running Nutanix you can find out what the active working set of a VM is via PRISM (See post here) and if you’re looking to size for a Nutanix solution, use my rule of thumb for sizing for storage performance in the new world.

What I/O will Nutanix Erasure coding (EC-X) take effect on?

In recent weeks I have been presenting at a number of Nutanix .NEXT roadshow events and I was asked a good question about Erasure Coding (EC-X) at the Melbourne event which I felt justified a quick post.

The question was along the lines of:

How does Erasure Coding affect Write intensive workloads?

The question came following a statement I made which was to the effect of enabling RF3 + Erasure Coding may prove to be an excellent default container configuration when talking about resiliency and capacity optimization.

So let’s take a look at the Write path for a Nutanix XCP environment with EC-X enabled:

ECXprocess

Step 1: Confirm the data resiliency being RF2 or RF3 (FTT1 / FTT2 in other vendor speak)

Step 2: Is the I/O random or sequential

Step 3: Is the Data Write Hot?

This is where we start talking about EC-X and one of the areas where Nutanix patent pending algorithm shines. The XCP monitors the data and when the data is write hot, EC-X will not be performed on that data and the blocks (or “extents” in Nutanix Distributed File System speak) will remain in the SSD tier.

Step 4: If the data is not Write Hot, perform EC-X on the data.

Step 5: Is the data Read hot?

What do I mean by read hot? Basically is the data being read frequently (but not overwritten). If it is Read Hot, the data will remain in the SSD tier having previously been striped by EC-X.

As a result, more data can now fit into the SSD tier giving better overall performance for a larger working set.

Step 6: If the data is not Read Hot (and not write hot) it will be a candidate for migration to the low cost SATA tier via Nutanix ILM (Intelligent Life-cycle Management) process which runs in real time (not on a scheduled basis).

So will a write intensive workloads performance be degraded if EC-X is enabled?

Short answer: No

If the container where the write intensive workload is running is configured with EC-X, the data which is write intensive will simply not be subject to EC-X as the platform understands and monitors the data and only applied EC-X if the data becomes write cold.

So the good news is, even if you enable EC-X it will not impact write intensive workloads, but it will provide capacity savings and an effective increase in usable SSD tier for the data which is Write Cold, Read Hot/Cold.