Cost vs Reward for the Nutanix Controller VM (CVM)

I hear a lot of FUD (Fear Uncertainty and Doubt) getting thrown around about the Nutanix Controller VM (CVM) being a resource (vCPU/vRAM) hog.

So I thought I would address this perceived issue.

For those of you who are car people, you will understand the benefits of a Supercharger increasing performance of an engine.

The supercharger does this by attaching a belt to a pulley connected to the motor which spins the supercharger to force more air into the combustion chambers. This allows more fuel to be added to the mix to produce higher horsepower from the same engine displacement (engine capacity, ie: 2.0 Litres)

What is downside of a Supercharger?

The supercharger belt connected to the pulley can require even hundreds of horsepower to simply drive the supercharger. As such, a 300HP engine may have to use half of its power to just drive the supercharger.

So for example, a 300HP engine less 60HP (25%) to drive the supercharger equates to only 240HP remaining. But, as a result of the supercharger forcing more air into the engine, the engine now produces an additional 200HP.

So the “cost” of running the supercharger is 60HP, but the overall benefit is 200HP, resulting in the engine now producing 440HP.

Let’s now relate this back to the Nutanix Controller VM (CVM).

The CVM provides the storage features,functionality,excellent scalability and performance for the Virtual Machines. For example, reducing the latency thanks to Data Locality keeping data local to the compute node running the VM for faster reads and writes.

The faster the reads and writes, the less time VMs spend in a “CPU wait” state waiting for I/Os to be acknowledged by the storage which means the CPUs are being more efficiently utilized. This is a small part of the value the Nutanix CVM provides.

In Summary, the CVM does use some compute resources from the host (which depend on the node type and performance required) but like a Supercharger to an engine, the Nutanix CVM delivers significantly higher value to the VMs than the resources it uses.

Related Articles:

1. Rule of Thumb: Sizing for Storage Performance in the new world.

2. Is VAAI beneficial with Virtual Storage Appliance (VSA) based solutions ?

3. PART 1 – Problems with RAID and Object Based Storage for data protection

PART 2 – Problems with RAID and Object Based Storage for data protection
Following on from Part 1, this post will discuss hyper-converged Distributed File Systems (i.e,: Nutanix) and compare with traditional SAN/NAS RAID and  hyper-converged solutions using Object storage for data protection.

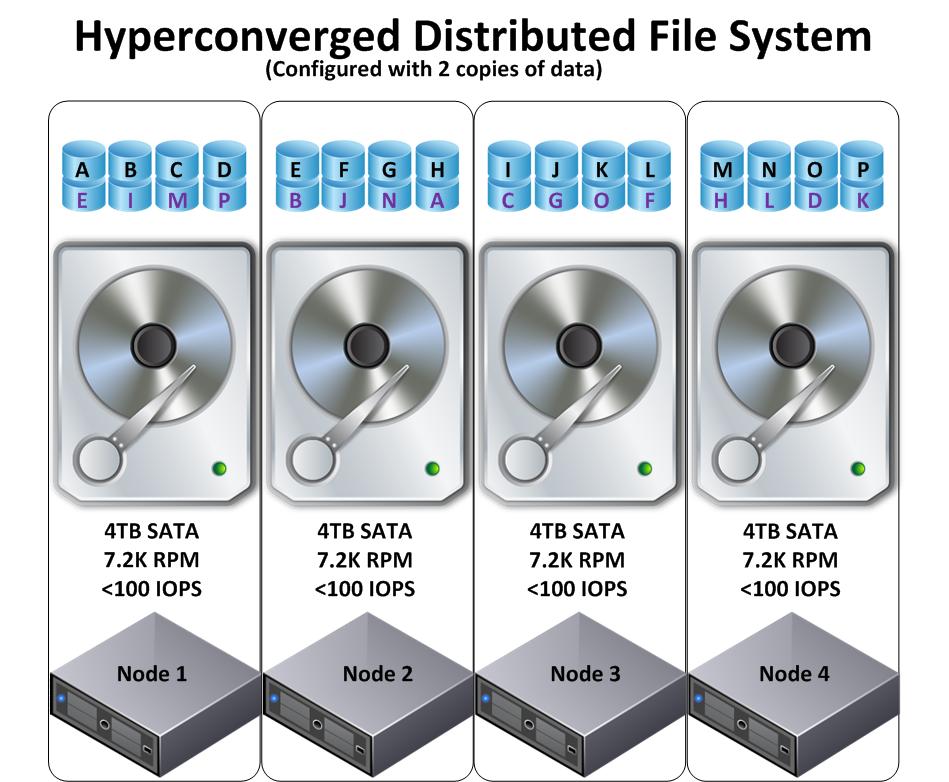
The below diagram shows a 4 node hyper-converged solution using a Distributed File System with the same 4 x 4TB SATA drives with data protection using replication with 2 copies. (Nutanix calls this Resiliency Factor 2)

HyperconvergedDFSNormal

The first difference you may have noticed, is the data is much more granular than the Hyper-Converged Object store example in Part 1.

The second less obvious difference is the replicated copies of the data (i.e.: The data with Purple letters) on node 1 do not reside on a single other node, but are distributed throughout the cluster.

Now lets look at a drive failure example:

Here we see Node 1 has lost a Drive hosting 8 granular pieces of data 1MB in size each.

HyperconvergedDFSRecovery

Now the Distributed File System detects that the data represented by A,B,C,D,E,I,M,P has only a single copy within the cluster and starts the restoration process.

Lets walk through each step although these steps are completed concurrently.

1. Data “A” is replicated from Node 2 to Node 3
2. Data “B” is replicated from Node 2 to Node 4
3. Data “C” is replicated from Node 3 to Node 2
4. Data “D” is replicated from Node 4 to Node 2
5. Data “E” is replicated from Node 2 to Node 4
6. Data “I” is replicated from Node 3 to Node 2
7. Data “M” is replicated from Node 4 to Node 3
8. Data “P” is replicated from Node 4 to Node 3

Now the cluster has restored resiliency.

So what was the impact on each node?readwriteiorecovery

The above table shows a simplified representation of the workload of restoring resiliency to the cluster. As we can see, the workload (being 8 granular pieces of data being replicated) was distributed across the nodes very evenly.

Next lets look at the advantages of a Hyper-Converged Solution with a Distributed File System (which Nutanix uses).

  1. Highly granular distribution using 1MB extents not large Objects.
  2. The work required to restore resiliency after one drive (or node) failure was distributed across all drives and nodes in the Cluster leveraging all drives/nodes capability. (i.e.: Not constrained to the <100 IOPS of a single drive)
  3. The restoration rebuild is a low impact activity as the workload is distributed across the cluster and not dependant on source/destination pair of drives or nodes
  4. The rebuild has a low impact on the virtual machines running on the distributed file system and consistent performance is maintained.
  5. The larger the cluster the quicker and lower impact the rebuild is as the workload is distributed across a higher number of drives/nodes for the same size (Gb) worth of restoration.
  6. With Nutanix SSDs are used not only for Read/Write cache but as a persistent storage tier, meaning the recovering data will be written to SSD and where the data being recovered is not in cache (Memory or SSD tiers) it is still possible the data will be in the persistent SSD tier which will dramatically improve the performance of the recovery.

Summary:

As discussed in Part 1, Traditional RAID used by SAN/NAS and Hyper-converged solutions using Object based storage both suffer similar issues when recovering from drive or node failure.

Where as Nutanix Hyper-converged solution using the Nutanix Distributed File System (NDFS) can restore resiliency following a drive or node failure faster and with lower impact thanks to its highly granular and distributed architecture, meaning more consistent performance for virtual machines.

Rule of Thumb: Sizing for Storage Performance in the new world.

In the new world where storage performance is decoupled with capacity with new read/write caching and Hyper-Converged solutions, I always get asked:

How do I size the caching or Hyper-Converged solution to ensure I get the storage performance I need.

Obviously I work for Nutanix, so this question comes from prospective or existing Nutanix customers, but its also relevant to other products in the market, such as PernixData or any Hybrid (SSD+SAS/SATA) solution.

So for indicative sizing (i.e.: Presales) where definitive information is not available and/or where you cannot conduct a detailed assessment , I use the following simple Rule of Thumb.

Take your last two monthly full backups, and take the delta between them and multiply that by 3.

So if my full backup from August was 10TB and my full backups from September is 11TB, my delta is 1TB. I then multiply that by 3 and we get 3TB which is our assumption of the “Active Working Set” or in basic terms, the data which needs performance. (Because cold or inactive data can sit on any tier without causing performance issues).

Now I  size my SSD tier for 3TB of usable capacity.

The next question is:

Why multiple the backup data delta by 3?

This is based on an assumption (since we don’t have any hard data to go on) that the Read/Write ratio is 70% Read, 30% write.

Now those of you familiar with this thing called Maths, would argue 70/30 is 2.33333 which is true. So rounding up to 3 is essentially a buffer.

I have found this rule of thumb works very well, and customers I have worked with have effectively had All Flash Array performance because the “Active Working Set” all resides within the SSD tier.

Caveats to this rule of thumb.

1. If a customer does a significant amount of deletions during the month, the delta may be smaller and result in an undersized SSD tier.

Mitigation: Review several months of full backup logs and average the delta.

2. If the environment’s Read/Write ratio is much higher than 70/30, then the delta from the backup multiplied by 3 may again result in  an undersized SSD tier.

Mitigation: Perform some investigation into your most critical workloads and validate or correct the assumption of multiplying by 3

3. This rule of thumb is for Server workloads, not VDI.

VDI Read/Write ratio is generally almost opposite to server, and around 30/70 Read/Write. However the SSD tier for VDI should be sized taking into account the benefits of VAAI/VCAI cloning and things like de duplication (for Memory and SSD tiers) which some products, like Nutanix offer.

Summary / Disclaimer

This rule of thumb works for me 90% of the time when designing Nutanix solutions, but your results may vary depending on the platform you use.

I welcome any feedback or suggestions of alternate sizing strategies which I will update the post with where appropriate.