Nutanix gets Microsoft blessing for unique ESRP for a real world MS Exchange ESRP solution on All Flash

I am pleased to announce that Microsoft have approved Nutanix latest ESRP (Exchange Storage Review Program) submission for a 50,000 user deployment of MS Exchange on Nutanix NX-8150 all flash platform running the next generation hypervisor, AHV!

What’s unique about this you might ask?

  1. It’s the first hyper-converged (HCI) all flash ESRP solution (to compliment Nutanix existing Hybrid ESRP solutions for 24k users on Hyper-V and 30k users on AHV)
  2. The first multiple Exchange VM per node solution!!
  3. The first ESRP to provide MS Exchange Server role requirements calculator solution design
  4. The solution was performance tested/validated with N-1 nodes to simulate performance in the event a node had failed and was not replaced
  5. The solution supports the 1GB mailboxes without any assumed data reduction from compression, deduplication or Erasure Coding (EC-X)

The last point is key. Many vendors/solutions assume high data reduction ratios when sizing which adds risk to a project as I explained in Sizing infrastructure based on vendor Data Reduction assumptions. Nutanix (and me personally) rather give customers a guaranteed business outcome and while our data reduction is very effective especially for MS Exchange data, it can and does vary between customers. An ESRP should be a guaranteed outcome, and that’s what this unique ESRP from Nutanix delivers.

A major problem with many, if not most ESRP submissions is that they are not real world solutions, just storage platforms which can deliver high enough IOPS to potentially support a real world solution.

When designing the solution I planned to put forward for ESRP, I used an actual real world design for a Nutanix customer and ensures it was sized to be 100% real world.

For example, from a compute perspective the solution was sized with no CPU overcommitment and within the recommended maximum of 24 CPUs both of which ensure optimal CPU performance.

CPU sizing also ensures Exchange VMs fit within the NUMA node of the Nutanix node which ensures optimal memory performance, which is another key area to ensure optimal Exchange performance.

In addition, The VMs are sized to be under the Microsoft recommended CPU utilization threshold for a “Worst Failure Mode” of ≤ 80 percent.

From a real world perspective, MS Exchange is dependant on Active Directory. As a result the solution is also sized to support all the required Active Directory Global Catalog cores running on the same infrastructure.

From an availability and resiliency perspective, the solution is sized for N+1 at the infrastructure layer to compliment the N+1 at the MS Exchange DAG layer. This delivers customers a solution which has protection from multiple concurrent failures which is essential for Mission Critical applications.

In the real world, things change and having a solution which scales to support more users, more messages per day and greater mailbox capacity is essential.

The Nutanix NX-8150 All Flash ESRP discusses a scalable and repeatable model where the solution can be increased in size from supporting 1 GB mailboxes to >2 GB simply by choosing (configure to order) 3.84 TB drives vs. the 1.92 TB drives tested for this solution.

Another option is when the storage capacity is reaching a high threshold such as 80%+, customers can non disruptively add storage nodes to expand capacity. This can be done without any change at the OS or MS Exchange application layer and new capacity (and performance!) is available instantly.

Did you know Nutanix allows mixing all-flash & hybrid? This means the most active data (e.g.: Most recent email) is running in an all flash configuration and older mail is automatically and transparently migrated to the lower cost hybrid nodes.

From a storage performance perspective, the solution was tested with in-line compression enabled which is Nutanix official recommendation for MS Exchange as it provides excellent data reduction with no significant overheads.

Another focus are for Nutanix in the real world is reducing CAPEX and OPEX. A great example of this is the entire solution (excluding networking) uses just 10 rack units (RUs) per datacenter. While other vendors storage ESRPs will claim lower RU requirements, they excluding the physical servers required for the solution. Nutanix is advising the requirements for the compute and storage for the solution to be totally transparent.

This means the solution does not require a large investment in your datacenter or co-location and is cost effective to power and cool making the solution environmentally friendly as well.

From a performance perspective, the Nutanix solution was tested in an N-1 configuration to show the performance which can be achieved after the failure of a node within the cluster.

Even with a failed node, the solution achieves excellent performance with average database read and log write latency in the low 1ms range sustained for the 24 stress test required for ESRP submissions.

A few performance highlights:

  1. Nutanix achieved an average of 5172 IOPS per MS Exchange Jetstress instance with just 4 threads!
  2. Database read latency avg of just 1.05ms
  3. Log write latency avg of just 1.21ms
  4. Database backup performance of 215MB/sec per database which equates to more than 1.7GBps per node!

While the achieved performance vastly exceeds the requirements for Exchange, the key factor is the reduced CPU WAIT time achieved which results in much greater CPU efficiency than a physical Exchange server with JBOD storage. Meaning a virtualised exchange server on Nutanix (even hybrid systems) is more efficient than Microsoft Preferred architecture using physical servers and JBOD storage.

You may be asking yourself, why does this matter? The answer is simple. MS Exchange becomes inefficient when scaled up beyond 24 cores so the more efficient the usage of those cores, the more users, messages per day and better user experience can be achieved without scaling up or adding more servers.

So without further delay, I have provided the direct link to the document below for you convenience.

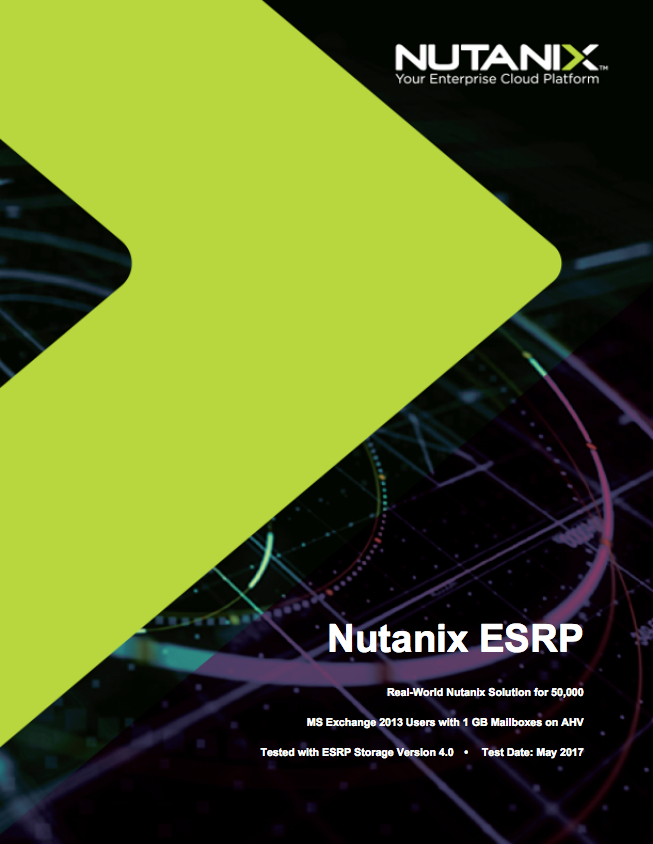
Nutanix ESRP – NX-8150-G5 All Flash 50,000 Users

ntnxallflashesrp

The truth about storage benchmarking

Recently I was asked to review some performance testing done by an external party and my initial impression was the performance was well below what I expected.

So over the weekend I setup a block in my lab to reproduce the tests to see if the results were firstly repeatable, and if so, what performance would I get with and without tuning.

The only significant difference between my hardware and the hardware used by the 3rd party was that I used old dual socket Ivy Bridge E5-2670 2.6Ghz 8c processors and the 3rd party had a much newer dual Broadwell E5-2640 v4 2.4Ghz processors.

If we compare the two processors using CPUBoss.com we see the following:

CPUboss1

Not surprisingly the Broadwell E5-2640 v4 processor is faster, but possibly less than you would expect with a 16.28% better PassMark per core, and in my opinion, the per core value quite importaint especially when considering business critical applications.

None the less, a 16.28% performance improvement per core will be a significant factor for a benchmark with Nutanix as the Controller VM (CVM) is powered by the CPU of the host.

I thought I would whip up a quick post about performance benchmarking to show how different performance results can be on the same hardware depending on just a few factors and why storage benchmarking, especially competitive benchmarking, cannot and should not be trusted when making purchasing decisions.

This test was for a 10k user MS Exchange deployment and the hardware used for testing was performed on in both cases was 1 x 1.92TB SSD and 3 x 4TB SATA drives and they were both tested on the same GA Nutanix AOS build.

The required (or Target) IOPS was just 216 per MS Exchange instance (VM) as shown below by the Jetstress report.

TargetIO

This target is calculated by Jetstress when using the “Exchange Mailbox Profile” test scenario with the following configuration:

MailboxProfile2

The resulting SSD vs SATA ratio makes this test largely about the limitations of SATA performance as >87% of data is being read from the SATA tier.

TierUsage

Test 1: The Jetstress dataset was created and then the performance test was immediately ran for 2hrs with no pre-warming of the metadata or read cache.

Achieved Transactional I/O: 200.663
Avg Log Write Latency: 1.06ms
Avg DB Write Latency: 1.4ms
Avg DB Read Latency: 14ms

This result was 15.61% lower than the 3rd parties result and interestingly if we correct for CPU core performance, it’s less than 1% difference. As this was in line with my expectation knowing the importance of CPU clock speed, I would say for this testing that the baseline results were comparable.
Test 2: The Nutanix tiering was tuned to suit large working sets (which vastly exceed the SSD tier) and the Jetstress dataset was created and the performance test was immediately ran for 2hrs again with no pre-warming of the metadata or read cache.

Before we get to the results, I want to point out that Jetstress is in some ways is very good but in other ways a very unrealistic benchmarking tool as the entire dataset is “active” which is not the case in the real world. However, in one way this is a good thing because a passing Jetstress result in my experience means the production deployment performs very well from a storage perspective especially when using tiered storage which is built around the assumption not all data is active. As a result, a Jetstress test could be considered a “worse case scenario” style test for intelligent tiered storage.

Achieved Transactional I/O: 249.623
Avg Log Write Latency: 0.99ms
Avg DB Write Latency: 1.5ms
Avg DB Read Latency: 12ms

Test 3: I then setup Jetstress as per Nutanix MS Exchange best practices and ran the test again with no pre-warming of the metadata or read cache.

Achieved Transactional I/O: 389.753
Avg Log Write Latency: 0.95ms
Avg DB Write Latency: 2.0ms
Avg DB Read Latency: 17ms

Test 4: I then lowered the Jetstress thread count to the lowest value (roughly 33% lower) which I estimated would achieve the target IOPS (this is to simulate real world requirements) and ran the test again with no pre-warming of the metadata or read cache.

Achieved Transactional I/O: 300.254
Avg Log Write Latency: 0.94ms
Avg DB Write Latency: 1.5ms
Avg DB Read Latency: 12ms

Note: Test 4 achieved the highest I/O per thread.

Test 5: The same configuration as Test 4 but with pre-warming of the metadata cache.

Achieved Transactional I/O: 334
Avg Log Write Latency: 0.98ms
Avg DB Write Latency: 1.9ms
Avg DB Read Latency: 12.4ms

Some of you might be asking, how did test 4 achieve higher transactional I/O and with lower read and write latency than Test 1 & 2 with less threads. Shouldn’t a higher thread count achieve higher IOPS?

The reasons is because the original thread count was pushing the SATA drives past their capabilities, leading to excessive latency. Lowering the thread count allowed the SATA drives to operate at somewhere around their most efficiency range leading to lower latency.

Test 6: The same configuration as Test 5 but with tuned extent cache (RAM read cache) and 100% medadata cached.

Achieved Transactional I/O: 362.729ms
Avg Log Write Latency: 0.92ms
Avg DB Write Latency: 1.7ms
Avg DB Read Latency: 12ms

As we can see from Test 1 through to Test 6, the performance differs by up to 81% depending on how the platform is configured.

Side note and future looking statement. Many of the optimisations I performed above wont be required for long as many of the areas these optimisations help improve are being addressed in upcoming code. In saying that, for a business critical application like Exchange, I don’t think it’s a problem doing some optimisation as long as 90% of the workloads run well by default and we’re only tuning for the 10% (vBCA) workloads.

But out of interest, what would happen if we enabled data reduction? How much of a performance hit would that take?

Test 7: The same configuration as Test 6 but with In-line compression enabled.

Achieved Transactional I/O: 751.275
Avg Log Write Latency: 0.97ms
Avg DB Write Latency: 3.4ms
Avg DB Read Latency: 5.9ms

That’s a 107.46% increase in transactional IO and with in-line compression! Log write latency remained sub ms and read latency has almost halved.

Note: As Jetstress data is highly compressible, (Nutanix achieves 8:1 or higher with non default settings), I tuned the compression slice size to give a more realistic data reduction ratio. The ratio for this test was 3.99:1 and the ratio of SSD to SATA was almost exactly 50% as shown below.

TierUsageAfterCompression

Why did performance improve so much with In-Line compression? Well there is two main reasons:

  1. More data is being served from the SSD tier as compression allows more effective SSD tier capacity.
  2. Reads from SATA are faster as less physical data needs to be read to service an I/O due to it being compressed. The higher the compression ratio, the more this can improve.

As we can see, the results varied significantly and had I wanted to optimise the test further, I could have achieved even higher performance but there was no need. The requirements for the solution were already achieved and in the case of Test 7, the requirements were exceeded by 247% meaning the solution had heaps of headroom.

Nutanix best practice is to enable In-line compression for MS Exchange and other databases such as Oracle and SQL as per my tweet below.

This testing was performed on Nutanix Acropolis Hypervisor (AHV) but was not using the upcoming Turbo mode, which will further improve performance and lower overheads.

This is a key point many people forget when benchmarking. If we assume the platforms in question are scalable (e.g.: Like Nutanix), it doesn’t matter if one platform does 100k IOPS and another does 200k IOPS if your requirements are 20k IOPS. Both platforms capabilities vastly exceed the requirement (10k IOPS) from a performance perspective, so performance is not longer a significant factor in your purchasing decision.

Question: Are the above performance results genuine?

All of the above results could be argued to be genuine results, at the same time none of the above represent the best performance that could be achieved, yet the results could be used to try and create FUD if they are improperly represented (which is almost always the case with competitive comparisons whether intentional or otherwise).

Let’s say this was your proof of concept, What should be the take away from benchmarking results like this?

Simple: The solution meets/exceeds your performance requirements.

Now for the point of this article: The truth about storage benchmarking is that there are so many variables that can affect the results that unless you’re truely experienced in benchmarking your applications AND an expert in the platforms you’re benchmarking, your results are unlikely to be indicative of the platforms capabilities and therefore of very little value.

If you’re benchmarking Vendor A vs Vendor B, it’s a waste of time doing “Like for Like” benchmarking because the Virtual machine and application settings which are optimal for one vendor, will likely be different for the other vendor. e.g.: SAN vs HCI.

On the other hand, a more valid test would be vendor A’s best practices vs vendor B best practices, but again if one vendor Jetstress achieves 500 and the other achieves 400, that 20% higher performance is all but irrelevant if your requirements are say, 216 like in this case.

A very good example of invalid “like for like” benchmarking would be to size the active working set (i.e.: The capacity of the data you plan to benchmark against) to fit within the cache/SSD tier of one platform, but exceed the cache/SSD capacity of the other platform. The results will be vastly different and will not be indicative of real world performance. This is what vendors do when competitive benchmarking and it’s likely one of the main reasons we see End User License Agreements (EULA) from most if not all storage vendors preventing publishing benchmark results without written agreement.

So the (unpopular) truth about storage benchmarking is it’s not as easy and building a VM and running I/O meter with the same profile on multiple system like some vendors and even 3rd party storage analysts would have you believe. The vast majority of people (customers, analysts and even vendors) doing benchmarking don’t have the skill/experience to produce repeatable or meaningful results, especially on multiple platforms.

In fact it’s unrealistic/unreasonable to expect a person (customer, vendor, consultant) to be an expert in multiple platforms, and very few people are!

Related Articles:

  1. Peak Performance vs Real World Performance
  2. The Key to performance is Consistency

Splitting SQL datafiles across multiple VMDKs for optimal VM performance

After recently helping multiple customers resolve performance issues with vBCA workloads by configuring multiple PVSCSI adapters and spreading workloads across multiple VMDKs, I wrote: SQL and Exchange performance in a virtual machine.

The post talked about how you should use multiple PVSCSI adapters with multiple VMDKs spread evenly across the adapters to achieve optimal performance and reduce overheads.

But what about if you only have a single SQL database. Can we split it across multiple VMDKs and importantly, can we do this without downtime?

The answer to both, thankfully is Yes!

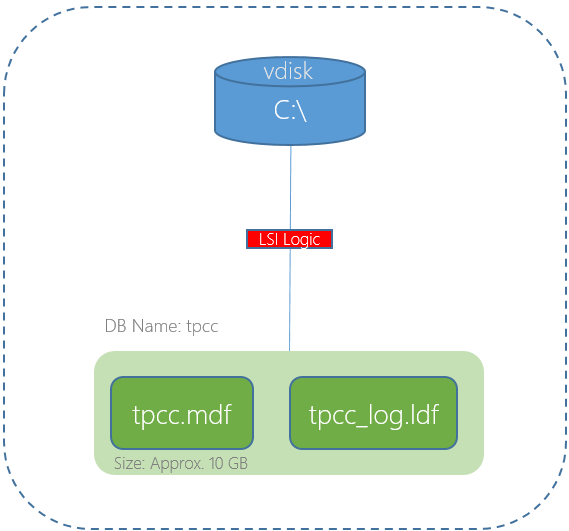
The below is an example of a worst case scenario for a SQL server database. A single VMDK (using a single SCSI controller) hosting the Operating System, Database and Logs, especially when it’s a business critical application.

In the above scenario the single virtual SCSI controller and/or the single VMDK could both result in lower than expected performance.

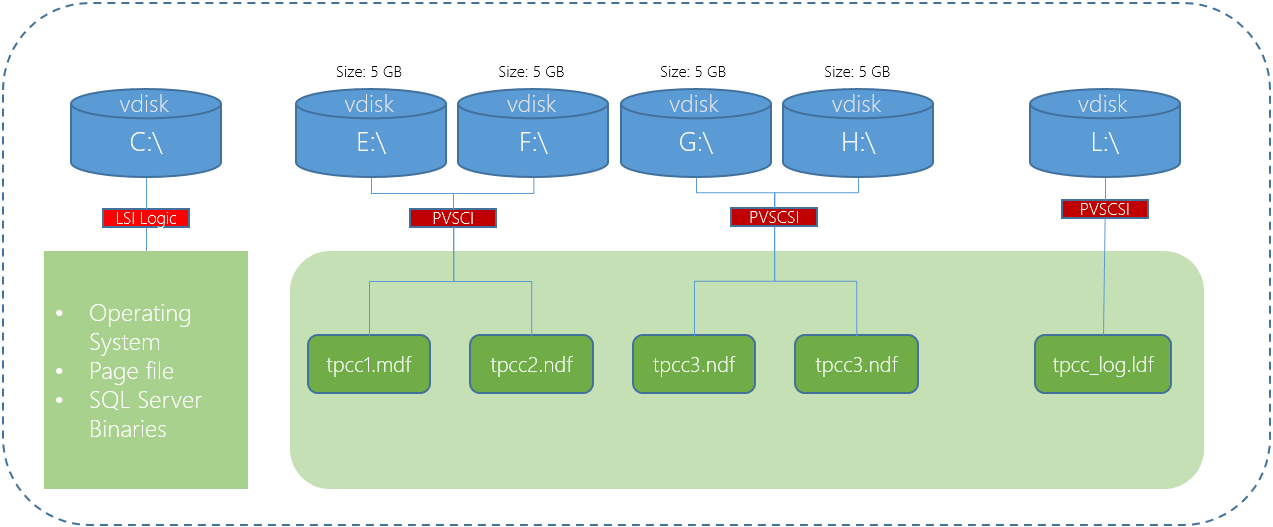
We have learned earlier that using multiple PVSCSI adapters and VMDKs is the best way to deploy a high performance solution. The below is an example deployment where the OS , Pagefile and SQL binaries are using one virtual controller and VMDK, then four VMDKs for database files are hosted by a further two PVSCSI controllers and the logs are hosted by a fourth PVSCSI controller and VMDK.

In the above diagram the C:\ is using a LSI Logic controller which in most cases does not constraint performance, however since it’s very easy to change to a PVSCSI controller and there are no significant downsides, I recommend standardizing on PVSCSI.

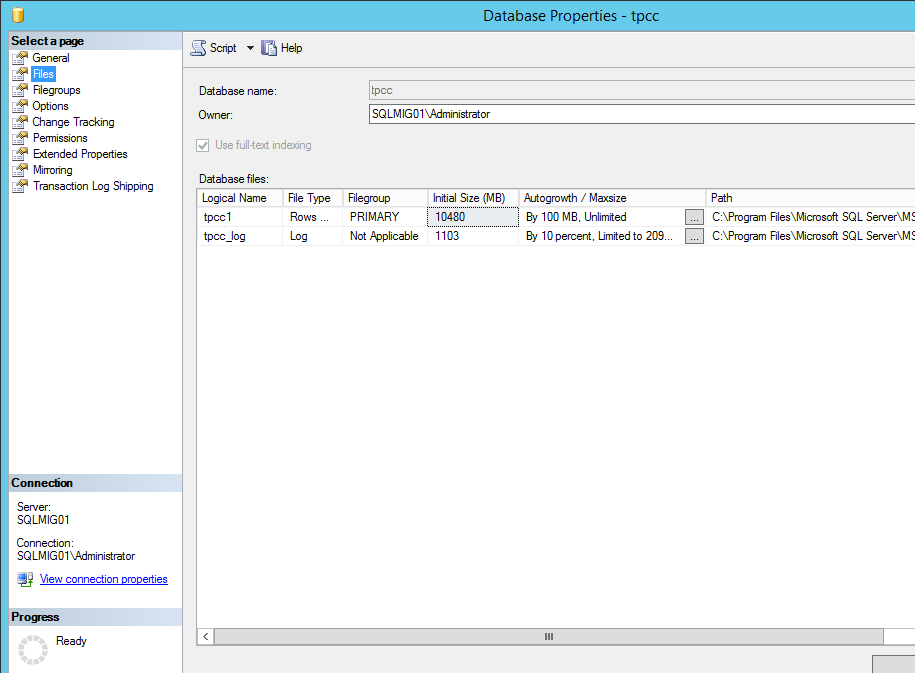
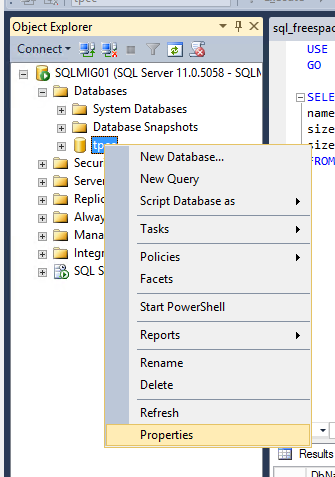
Now if we look at our current database, we can see it has one database file and one log file as shown below.

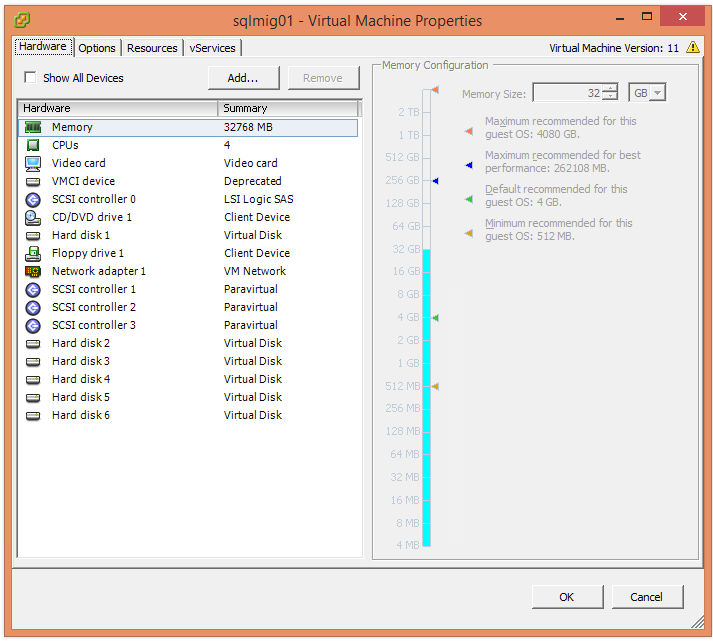
The first step is the update the Virtual machines disk layout as describe in the aforementioned article which should end up looking like the below:

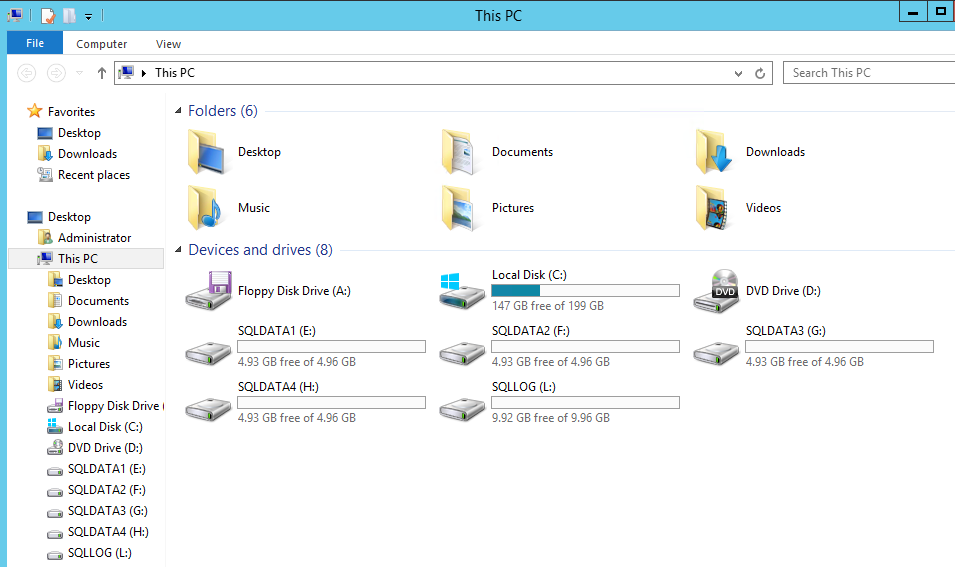
Next we go into Disk manager to rescan for the new storage devices, mark the drives are online, then format them with a 64k Allocation size which is optimal for databases. Once this is done you should check My Computer and see something similar to the below:

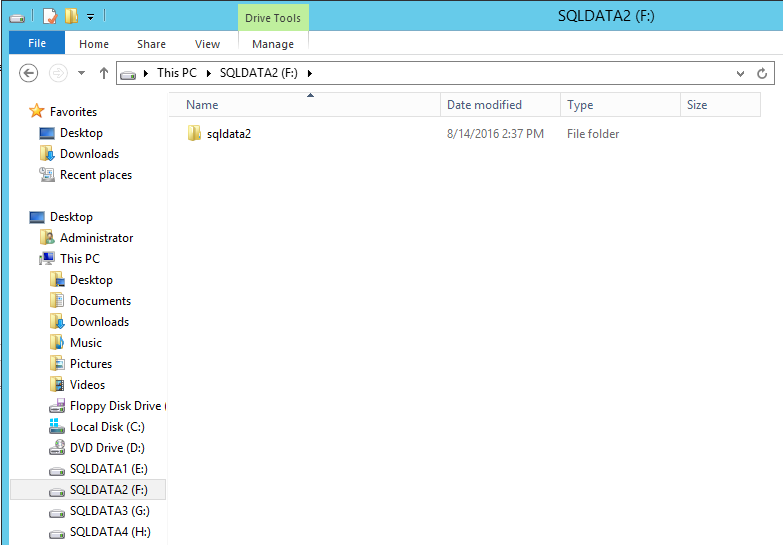
Next I recommend creating a directory for the database and log files rather than using the root directory so each drive should have a new folder as per the example below.

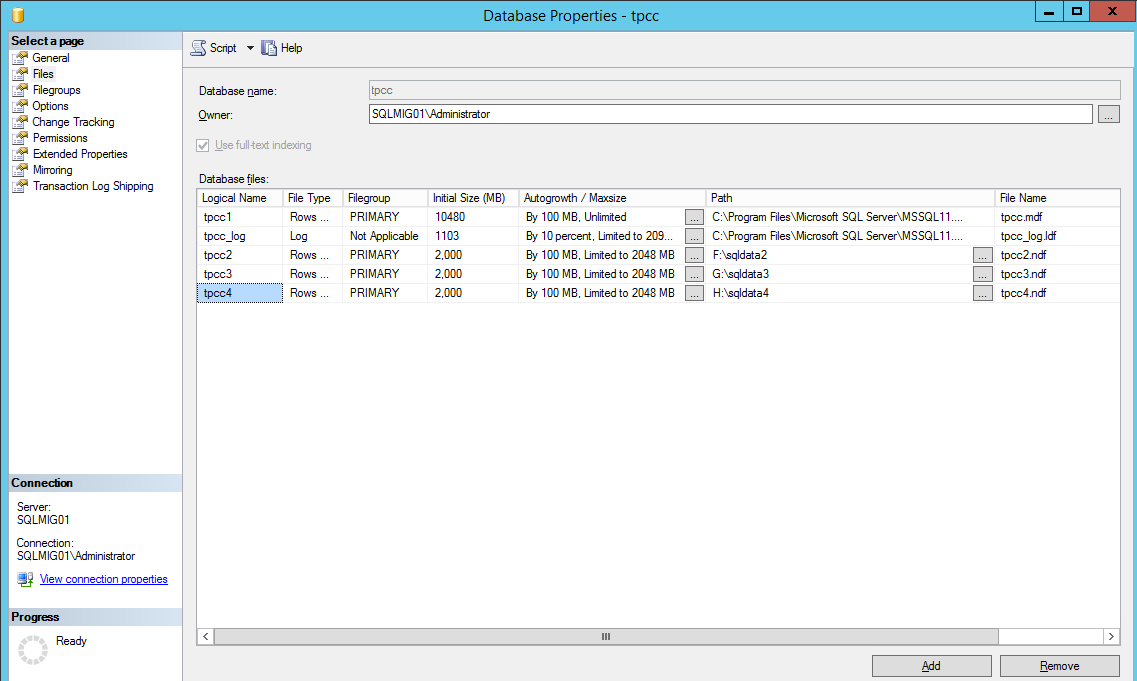
Next step is to create the new database files on each of new drives as shown below.

If the size of the original database is for example 10GB with say 2GB free space and you plan to split the database across 4 drives, then each of the new databases should be sized at no more than 2GB each to begin with. This prepares us to shrink the original DB and helps ensure the data is evenly spread across the new database files.

In the above screenshot, we can see the databases are limited to 2000MB, this is on purpose as we don’t want the database files expanding which can result in an uneven spread of data during the redistribution process I will cover later.

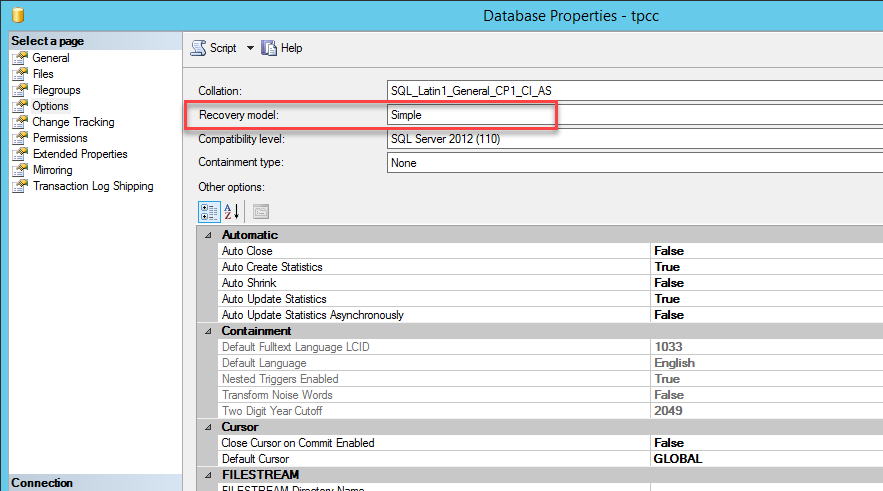
Switch the Recovery mode of Database to SIMPLE

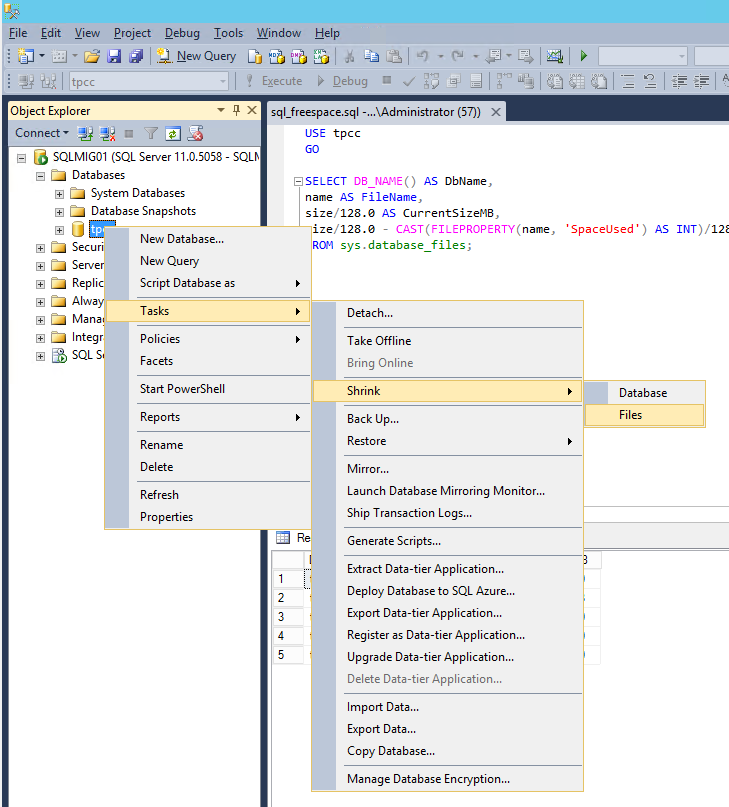
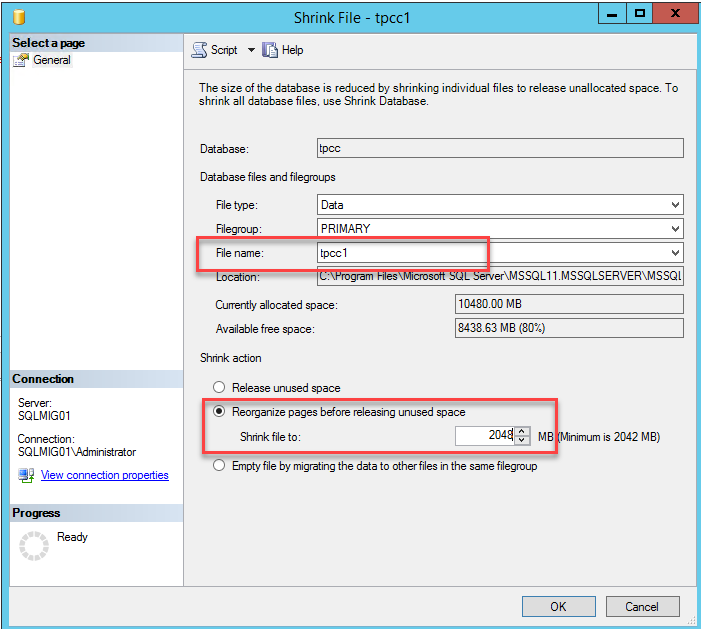
Now go to the database, navigate to Tasks, Shrink and select “Files”

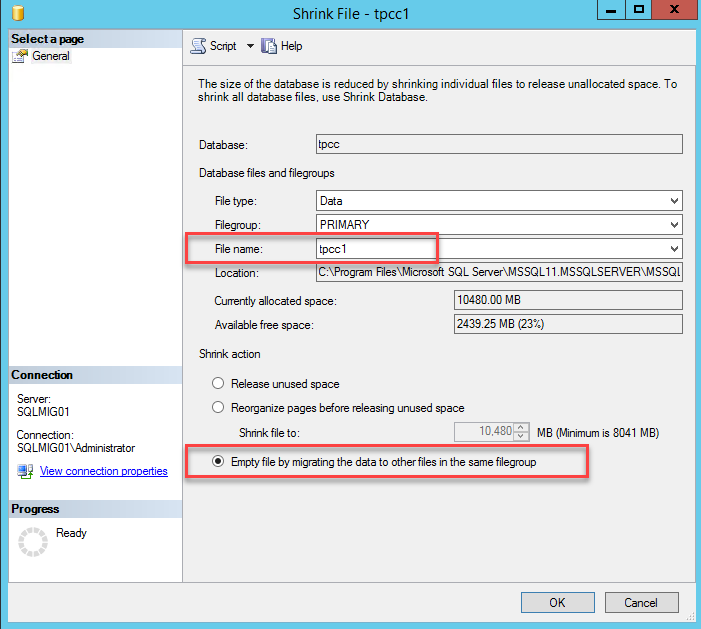
Now select the “Empty File by migrating data to other files in the same filegroup” option and press “Ok”.

Depending on the size of the database and the speed of the storage this may take some time and it will have at least some impact on the performance of the server. As such I recommend performing the process outside of peak hours if possible.

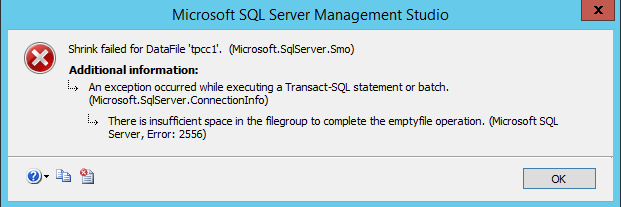
The error below is expected as we do not want to empty out the first *.mdf file completely. This is also an indication of our tasks being complete for empty file operation to the limit we’ve set earlier.

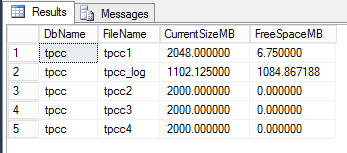
Once the task has completed you should see a roughly even distribution of data across the four database files by using the script below in query window.

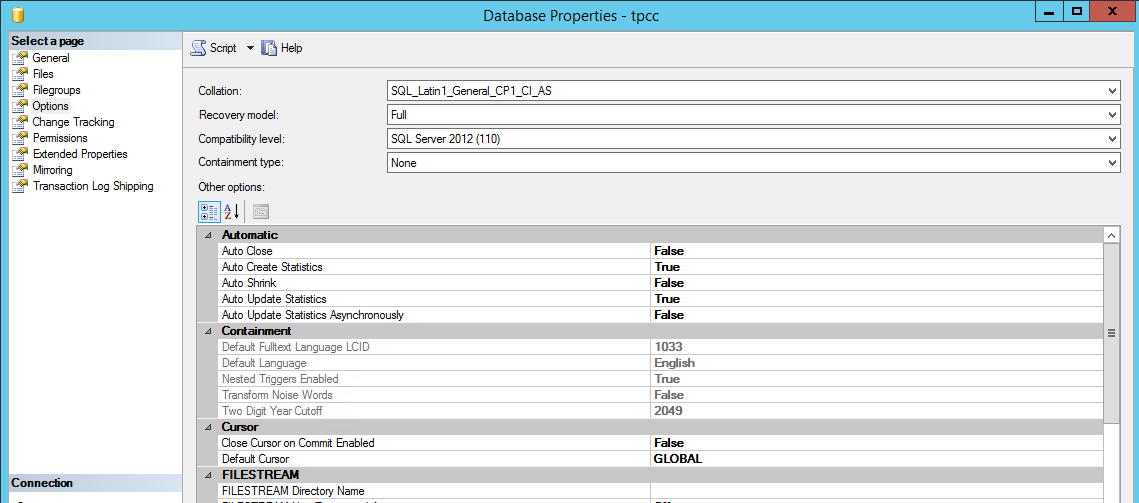
USE tpcc
GO
SELECT DB_NAME() AS DbName,
name AS FileName,
size/128.0 AS CurrentSizeMB,
size/128.0 - CAST(FILEPROPERTY(name, 'SpaceUsed') 
AS INT)/128.0 AS FreeSpaceMB
FROM sys.database_files;

C:\Users\Kasim\AppData\Local\Temp\SNAGHTMLd751ece.PNG

Next we want to configure autogrow onto our databases so they can grow during business as usual operations.

The above shows the database are configured to autogrow by 100MB up to a limit of 2048MB each. The amount a database should autogrow will vary based on the rate of growth in your database, as will the file size limit so consider these values carefully.

Once you have set these settings it’s now time to shrink the original final to the same size as the other database files as shown below:

This process cleans up white space (empty space) within the database.

So far we have achieved the following:

  1. Updated the VM with additional PVSCSI controllers and more VMDKs
  2. Initialized the VMDKs and formatted to the Guest OS
  3. Created three new database files
  4. Balanced the database across the four database file (including the original file)

We have achieved all of this without taking the database offline.

At this stage the virtual machine and SQL can be left as is until such time as you can schedule a short maintenance window to perform the following:

  1. Copy the original DB file from C: to the remaining new database VMDK
  2. Copy the original Logs file from C: to the new logs VMDK

This process only takes a few minutes plus the time to copy the database and logs. The duration of the file copy will depend on the size of your database and the performance of the underlying storage. The good news is with the virtual machine having already been partially optimized with more PVSCSI controllers and VMDKs, the read (copy) process will be served by one SCSI controller/VMDK and the paste (write) process served by another which will minimize the downtime required.

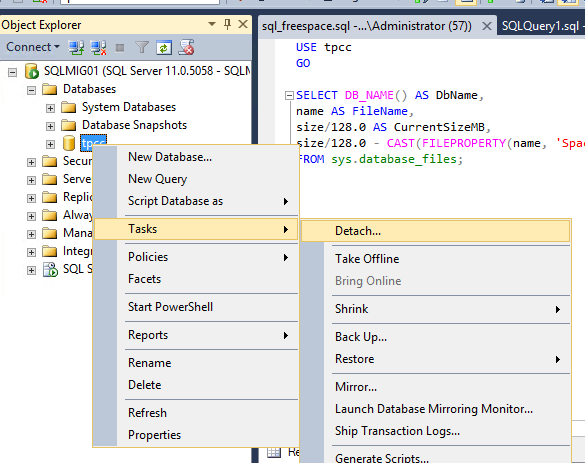
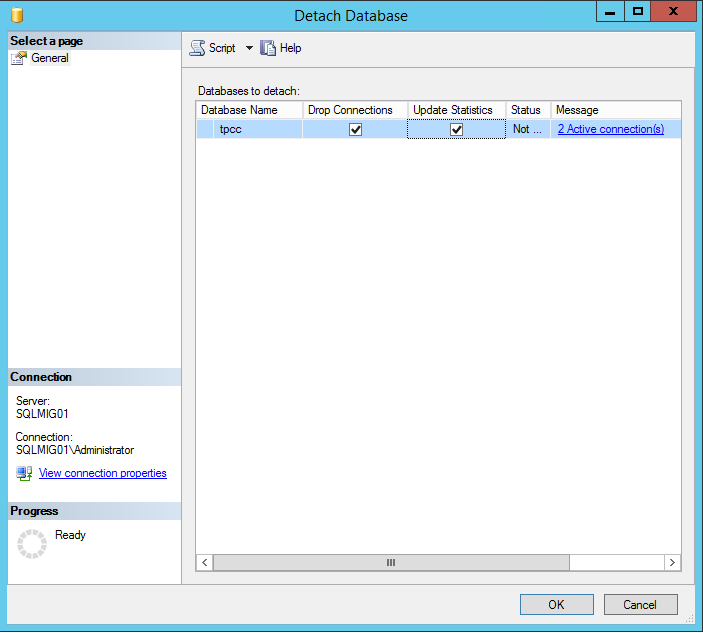
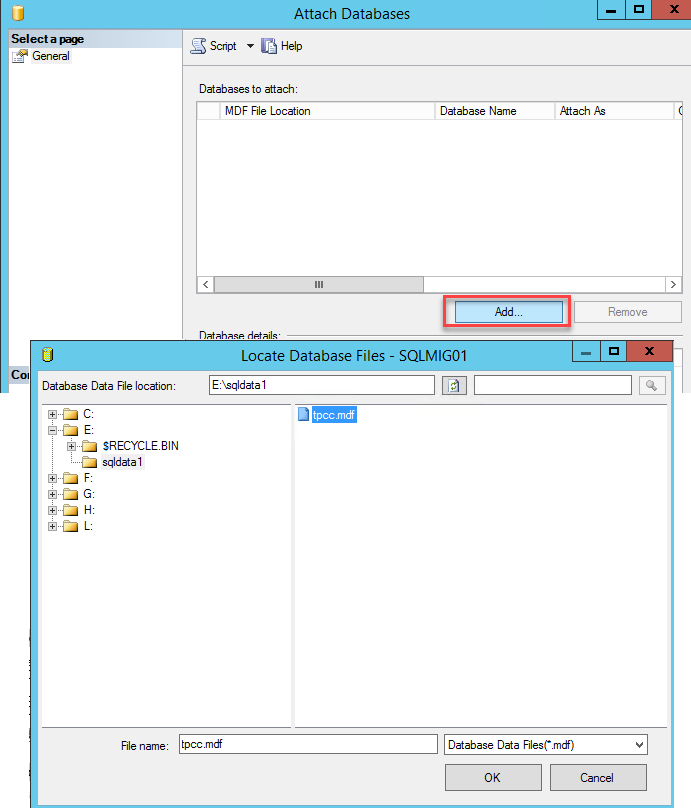
Once you have locked in your maintenance window, all you need to do is ensure all users and applications dependent on the database are shutdown, then detach the database and select the “Drop Connections” and “Update Statistics” and press Ok.


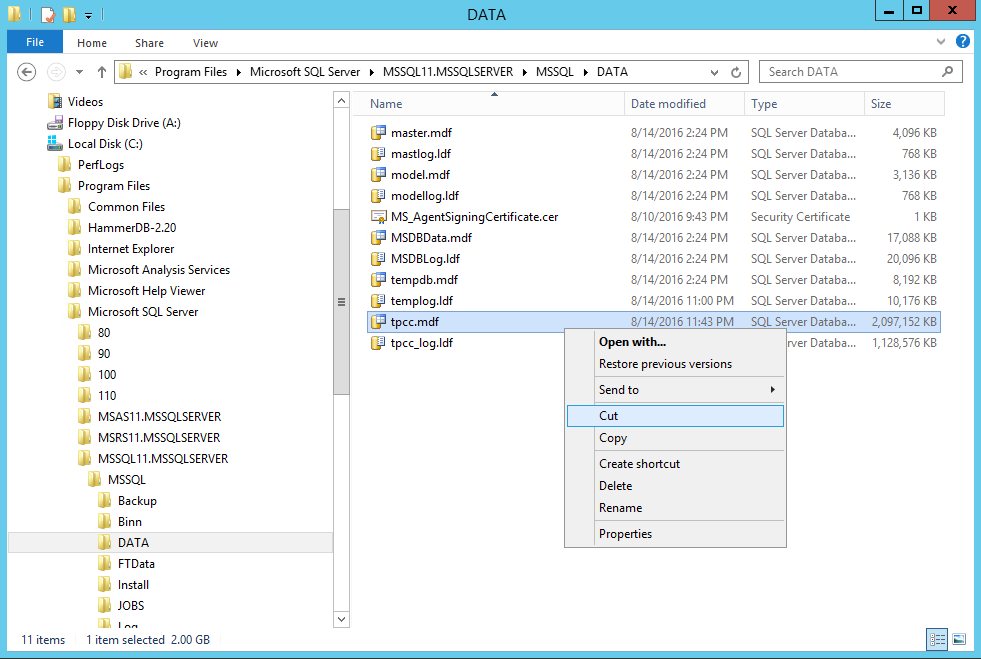
The next steps are very simple; we need to copy (or rather move/cut) the database from the original location as shown below:

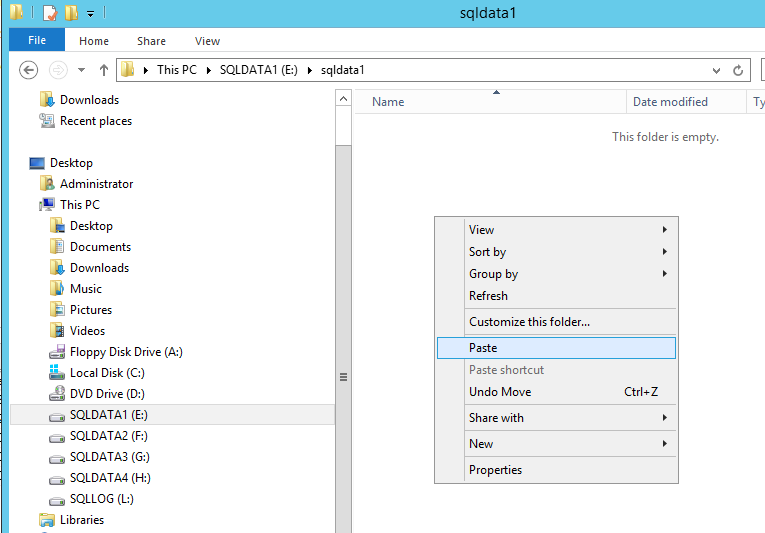
Now we paste the database file to the new data1 drive.

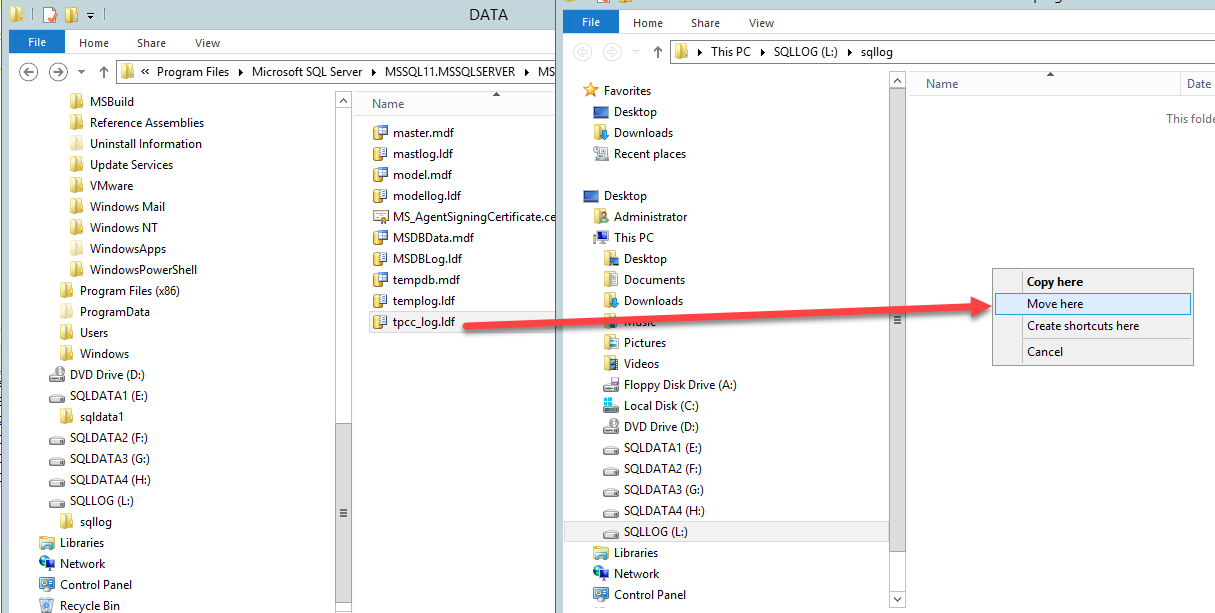
Then we copy the log file and paste it into the new log drive.

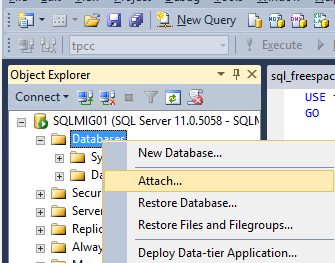
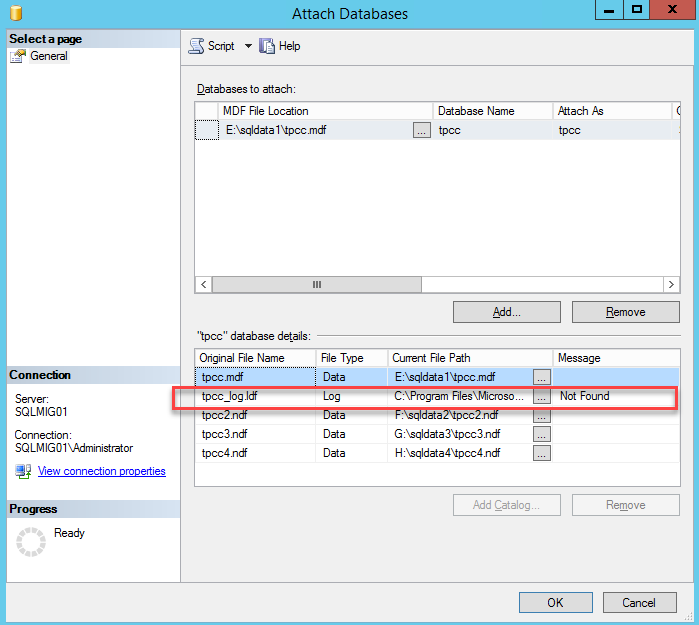
Now we simply reattach the database specifying the new location of the *.mdf file. You will note the message highlighted below which indicates the log files are not found which is expected since we have just relocated them.

C:\Users\Kasim\AppData\Local\Temp\SNAGHTMLd8094b4.PNG

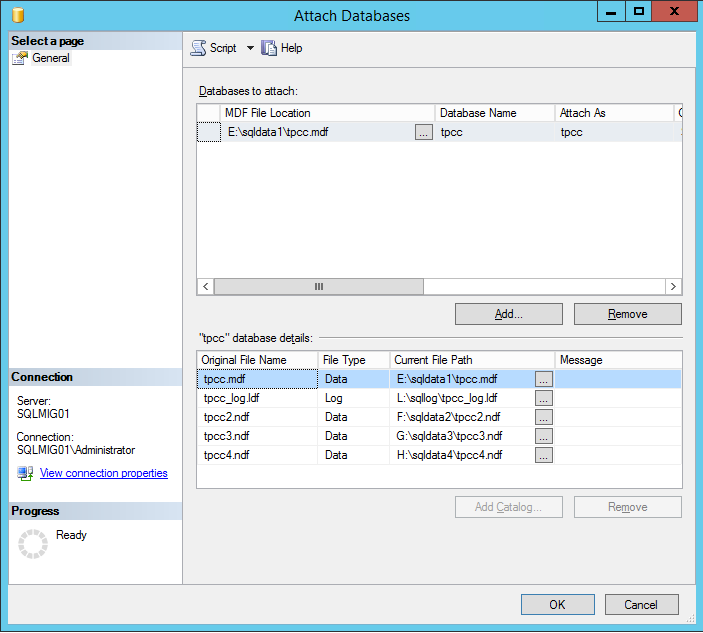
To resolve this simply update the path to the logs file as shown below and press Ok.

And we’re done! Simple as that.

Adjust the maximum growth of the datafile to an appropriate size. If you set to unlimited, please ensure that you monitor the volumes and manage them according to the growth rate of the database.

Lastly, don’t forget to change the database recovery model to Full

Now you have your OS separated from your SQL database and logs and all of the drives are configured across four virtual SCSI controllers.

Summary:

If you have an existing SQL server and storage performance is considered a problem, before buying new storage (Nutanix or otherwise), ensure you optimize the virtual machines storage layout as the constraint may not be the underlying storage.

As this post explains, most of this optimization can be done without taking the database offline so you don’t really have anything lose in following this process. Worst case scenario is performance does not improve and you have eliminated the VM storage as the constraining factor and when you do implement new Nutanix nodes or any underlying storage, you will get the most out of it. Do follow some other best practices like RAM to vCPU balancing, SQL Memory optimization, Trace Flags and database compression, be it row or page.

Acknowledgements:

A huge thank you to Kasim Hansia from the Nutanix Business Critical Applications (vBCA) team for documenting this process and allowing me to publish this post using his screenshots. It’s a pleasure working with such a talented group at Nutanix both in the vBCA team and in the broader organization.

Related Articles:

  1. SQL and Exchange performance in a virtual machine
  2. How to successfully virtualize Microsoft Exchange
  3. MS support for SQL on NFS datastores