What’s .NEXT 2017 – AHV Turbo Mode

Back in 2015 I wrote a series titled “Why Nutanix Acropolis Hypervisor (AHV) is the next generation hypervisor” which covered off many reasons why AHV was and would become a force to be reckoned with.

In short, AHV is the only purpose built hypervisor for hyper-converged infrastructure (HCI) and it has continued to evolve in terms of functionality and maturity while becoming a popular choice for customers.

How popular you ask? Nutanix officially reported 23% adoption as a percentage of nodes sold in our recent third quarter fiscal year 2017 financial highlights.

Over the last couple of years I have personally worked with numerous customers who have adopted AHV especially when it comes to business critical applications such as MS SQL, MS Exchange.

One such example is Shinsegae who is a major retailer running 50,000 MS Exchange mailboxes on Nutanix using AHV as the hypervisor. Shinsegae also runs MS SQL workloads on the same platform which has now become the standard platform for all workloads.

This is just one example of AHV proven in the field and at scale to have the functionality, resiliency and performance to support business critical workloads.

But at Nutanix we’re always striving to deliver more value to our customers, and one area where there is a lot of confusion and misinformation is around the efficiency of the storage I/O path for Nutanix.

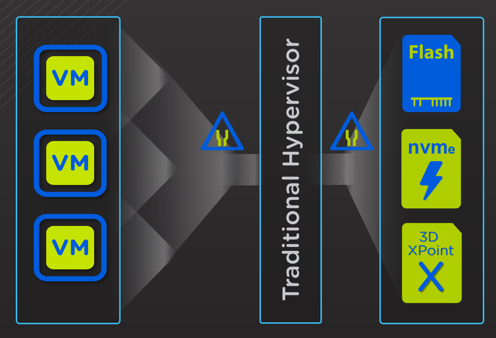
The Nutanix Controller VM (CVM) runs on top of multiple hypervisors and delivers excellent performance, but there is always room for improvement. With our extensive experience with in-kernel and virtual machine based storage solutions, we quickly learned that the biggest bottleneck is the hypervisor itself.

Next2017TraditionalHypervisorBottleneck

With technology such as NVMe becoming mainstream and 3D XPoint not far behind, we looked for a way to give customers the best value from these premium storage technologies.

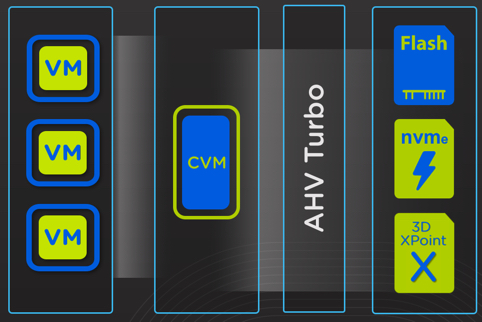
That’s where AHV Turbo mode comes into play.

Next2017AHVTurboMode

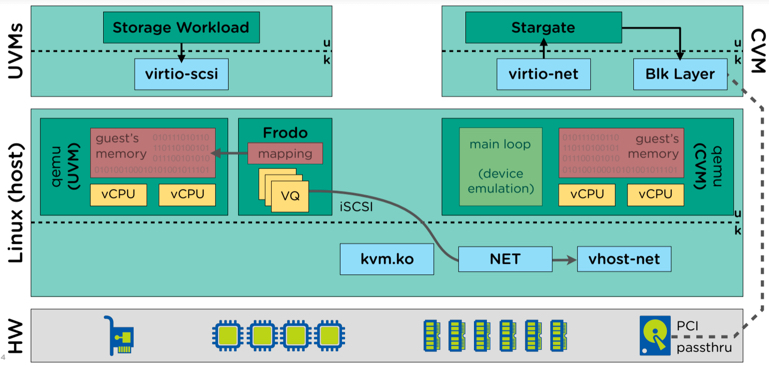
AHV Turbo mode is a highly optimised I/O path (shortened and widened) between the User VM (UVM) and Nutanix stargate (I/O engine).

These optimisation have been achieved by moving the I/O path in-kernel.

V

V

V

V

V

V

V

V

V

V

V

Just kidding! In-kernel being better for performance is just a myth, Nutanix has achieved major performance improvements by doing the heavy lifting of the I/O data path in User Space, which is the opposite of the much hyped “In-kernel”.

The below diagram show the UVM’s I/O path now goes via Frodo (a.k.a Turbo Mode) which runs in User Space (not In-kernel) and onto stargate within the Controller VM).

Next2017FrodoDatapath2

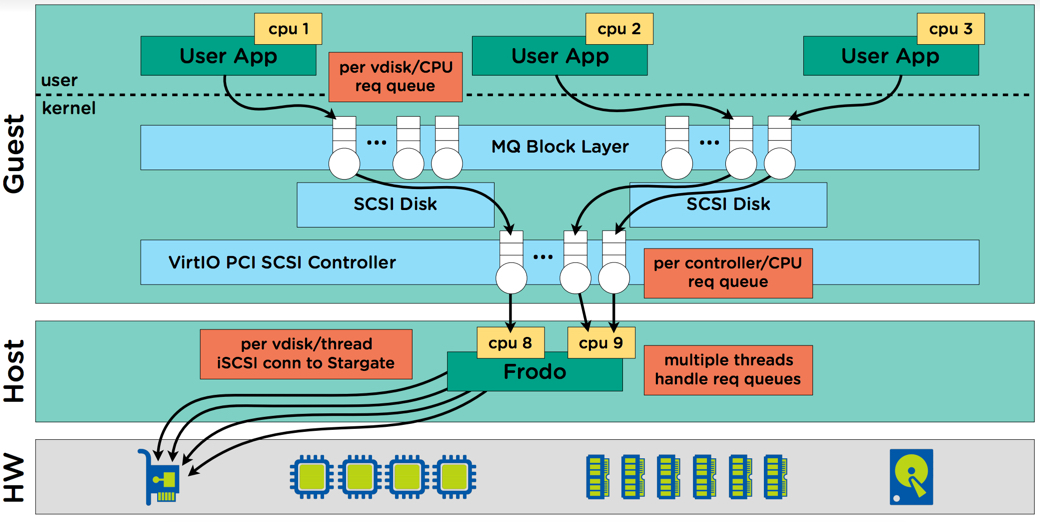
Another benefit of AHV and Turbo mode is that it eliminates the requirement for administrators to configure multiple PVSCSI adapters and spread virtual disks across those controllers. When adding virtual disks to an AHV virtual machine, disks automatically benefit from Nutanix SCSI and block multi-queue ensuring enhanced I/O performance for both reads and writes.

The multi-queue I/O flow is handled by multiple frodo threads (Turbo mode) threads and passed onto stargate.

Next2017FrodoUpdated

As the above diagram shows, Nutanix with Turbo mode eliminates the bottlenecks associated with legacy hypervisors, one such example is VMFS datastores which required VAAI Atomic Test and Set (ATS) to minimise the impact of locking when the numbers of VMs per datastore increased (e.g. >25). With AHV and Turbo mode, every vdisk has always had it’s own queue (not one per datastore or container) but frodo enhances this by adding a per-vcpu queue at the virtual controller level.

How much performance improvement you ask? Well I ran a quick test which showed amazing performance improvements even on a more than four year old IVB NX3450 which only has 2 x SATA SSDs per node and with the memory read cache disabled (i.e.: No reads from RAM).

A quick summary of the findings were:

  1. 25% lower CPU usage for the similar sequential write performance (2929MBps vs 2964MBps)
  2. 27.5% higher sequential read performance (9512MBps vs 7207MBps)
  3. A 62.52% increase in random read IOPS (510121 vs 261265)
  4. A 33.75% increase in random write IOPS (336326 vs 239193)

So with Turbo Mode, Nutanix is using less CPU and RAM to drive higher IOPS & throughput and doing so in user space.

Intel published “Code Sample: Hello World with Storage Performance Development Kit and NVMe Driver” which states “When comparing the SPDK userspace NVMe driver to an approach using the Linux Kernel, the overhead latency is up to 10x lower”.

This is just one of many examples which shows userspace is clearly not the bottleneck that some people/vendors have tried to claim with the “in-kernel” is faster nonsense I have previously written about.

With Turbo mode, AHV is the highest performance (throughput / IOPS) and lowest latency hypervisor supported by Nutanix!

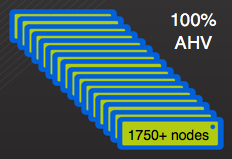
But wait there’s more! Not only is AHV now the highest performing hypervisor, it’s also used by our largest customer who has more than 1750 nodes running 100% AHV!

Next20171650Nodes

Dare2Compare Part 7 : HPE provides superior performance to Nutanix

In part 4, we covered off a series of failure scenarios and how the HPE/SVT product responds and the same scenarios and how Nutanix responds which clearly proved HPEs claim of having superior resiliency than Nutanix to be false and I would argue even highlighted how much more resilient the Nutanix platform is.

Now in part 7, I will address two false claims (below) that Nutanix has lower performance to HPE SVT and that Nutanix doesn’t post performance results.

Tweet #1 – HPE Simplivity 380 provides superior performance than Nutanix

Problem number 1 with HPE’s claim: Their URL is dead… so we cannot review what scenario/s they are claiming HPE/SVT is higher performing.

HPEBrokenURL

Before we discuss Nutanix performance, HPE have repeatably made further claims that Nutanix does not post performance results and have further complained there are no 3rd party published performance testing results.

One recent example of these claim is shown below which states: “I know you don’t publish performance results”

Nutanix does in fact publish performance data, which is validated by:

  • 3rd parties partners/vendors such as Microsoft and LoginVSI
  • Independant 3rd parties such as Enterprise Storage Group (ESG) and;
  • Internally created material

The following is a few examples of published performance data.

  1. Nutanix Citrix XenDesktop Validated by LoginVSI

In fairness to HPE, this is a recent example so let’s take a look at Nutanix track record with LoginVSI.

LoginVSIBenchmarks

Here we can see six examples dating back to Jan 2013 where Nutanix has made performance results with LoginVSI available.

2. Nutanix Reference Architecture: Citrix Validated Solution for Nutanix

This was a jointly developed solution between Citrix and Nutanix and was the first of it’s kind globally and was made available in 2014.

3. Microsoft Exchange Solution Reviewed Program (ESRP) – Storage

Nutanix has for many years been working with business critical applications such as MS Exchange and has published two ESRP solutions.

The first is for 24,000 Users on Hyper-V and the second is for 30k Users on AHV.

NutanixESRPScreenshot

Interestingly, while HPE/SVT have a reference architecture for MS Exchange, they do not have an ESRP for the platform and this is because they cannot provide a supportable configuration due to lack of multi-protocol support.

Nutanix on the other hand has Microsoft supportable configurations for ESXi, Hyper-V and AHV.

4. ESG Performance Analysis: Nutanix Hyperconverged Infrastructure

This report is an example of a 3rd party who has validated performance data for VDI, MS SQL and MS Exchange.

As we can clearly see with the above examples, Nutanix does and has for a long time provided publicly available performance data from many sources including independant 3rd parties.

Moving onto the topic of Nutanix vs HPE/SVT performance, I feel it’s importaint to first review my thoughts on this topic in detail in an article I wrote back in 2015 titled: Peak performance vs real world performance.

In short, I can get any two products and make one look better than the other by simply designing tests which highlight strengths or weaknesses of either product. This is why many vendors have a clause in the EULA preventing publishing of performance data without written permission.

One of the most importaint factors when it comes to performance is sizing. An incorrectly sized environment will likely not perform within acceptable levels, and this goes for any product on the market.

For next generation platforms like Nutanix, customers are protected from under-sizing because of the platforms ability to scale by adding additional nodes. In 2016 I wrote the post titled “Scale out performance testing with Nutanix Storage Only Nodes” which shows how adding additional storage only nodes to a Nutanix cluster increased IOPS by approx 2x while lowering read and write latency.

What is more impressive than the excellent performance improvements is this was done without any changes to the configuration of the cluster or virtual machines.

The same test performed on HPE/SVT and other SDS/HCI products cannot double the IOPS or decrease read/write latency as the SVT platform is not a distributed storage fabric.

Here in lies a major advantage to Nutanix. In the event Nutanix performance was no longer sufficient, or another platform was higher performance, say per node, then Nutanix can (if/when required) scale performance without rip/replace or reconfiguration to meet almost any performance requirement. The performance per node is not a limiting factor for Nutanix like it is with HPE/SVT and other platforms.

What about performance for customers who are maximising the ROI from existing physical servers using Acropolis Block Services. The benefits just keep coming. A server connected using ABS will improve its IOPS, latency and throughput when additional nodes are added to the Nutanix cluster automatically as the Acropolis Distributed Storage Fabric (ADSF) increases the number of paths dynamically so all Controller VMs in the cluster service ABS traffic as shown in the tweet below.

As such, regardless of if workloads are virtual or physical, when using Nutanix, performance can always be improved non-disruptively and without compromising the resiliency of the cluster by simply adding nodes (which BTW is a one click operation).

Summary:

  1. Nutanix has been publishing performance results through independant 3rd parties and partners for many years.
  2. Nutanix has validated solutions from Microsoft, LoginVSI and Citrix to name a few.
  3. Nutanix performance can scale well beyond HPE/SVT for both virtual and physical workloads
  4. Nutanix provides validated performance data across multiple hypervisors
  5. HPE/SVT have provided no evidence, scenarios or references to SVT being a higher performance platform.

Return to the Dare2Compare Index:

Dare2Compare Part 6 : Nutanix data efficiency stats can’t be found

If you’ve not read Parts 1 through 5, we have already proven several claims by HPE Simplivity regarding Nutanix to be false, as well as explored the misleading way in which HPE SVT promote data efficiency.

We continue with Part 6 where we will discuss HPE’s claim that “Nutanix data efficiency stats are stealthier than a ninja”. (below)

While HPE’s claim is an attempt to create Fear, Uncertainty and Doubt (FUD), HPE are partially correct in that we (Nutanix) have done a very poor job of promoting the arguably market leading data efficiency that Nutanix provides.

In fact, several colleagues and I created a feature request to properly report in a clear and detailed way, the ADSF data efficiencies and I am pleased to say these changes were included as part of the recent AOS 5.1 release.

Now what Nutanix users see in PRISM “Storage” view is (as shown below):

  1. A Capacity optimization overview
  2. Data reduction ratio which is made up of deduplication, compression and erasure coding savings*.
  3. Data reduction savings which is a total GB/TB/PB value from data reduction
  4. An Overall Efficiency ratio which is a combination of Data Reduction, Cloning and Thin Provisioning

*Metadata copies/snapshops/pointers etc are not included in the deduplication value as they are not deduplication.

The resulting summary is very clear and easy to understand so customers can see what efficiencies are from data reduction, and which savings (which typically form by far the largest “efficiency”) come from Cloning and thin provisioning.

DataReductionSummary2

One major item which will be included in an upcoming release is zero suppression. Zero suppression is a capability which has been in Nutanix Distributed Storage Fabric since Day 1 and it avoids unnecessarily storing zeros, instead storing metadata which achieves the same outcome but is much higher performance and uses much less capacity.

Nutanix snapshots or pointer based copies (depending on how you refer to them) are also not included in the overall efficiency number, however these will also be included as a seperate line item in a future release as we aim to be very clear regarding what data efficiencies a customer is achieving with Nutanix.

Some vendors recommend Eager Zero Thick (EZT) VMDKs on vSphere, and then deduplicate the zeros which artificially increases the deduplication ratio. Nutanix does not do this as it’s inefficient to create more data to deduplicate when you can simply avoid writing the data in the first place. However we do plan to report the savings from Zero suppression as a seperate line item as it is a value our platform provides.

For a more detailed view, Nutanix customers can dive down into the storage,Diagram view where admins can view of each containers data efficiency breakdown (as shown below).

DetailedContainerView

As we can see, Nutanix is very transparent showing what data reduction features are enabled, what ratio is being achieved, the total, used, reserved and even Thick Provisioned storage with an effective free based on physical multiplied by data reduction ratio and an overall efficiency value.

Now that we’ve covered off how Nutanix measures and reports on data reduction/efficiency, I’d like to highlight a critical factor when discussing data reduction/efficiency and that is that data efficiency is totally dependant on the individual customers data. For the same dataset, the difference between vendors with the same capabilities, e.g.: Deduplication, Compression and Erasure Coding (EC-X) are unlikely to be vastly different (or better put, change a business outcome one way or another) despite what each vendor will say about their implementation of such technologies.

In short: The biggest factor in the achieved data reduction is not the vendor, it’s the customer data.

With that said, if you’re comparing HPE SVT and Nutanix, then there is a pretty major delta between the two products in terms of capabilities and that is because Nutanix supports Erasure Coding (EC-X) and HPE SVT does not.

As a result, Nutanix has a major advantage as Erasure Coding in the Nutanix Acropolis Distributed Storage Fabric (ADSF) is complimentory to both deduplication and compression.

Unlike Compression and Deduplication, Erasure Coding can provide savings (or another way to look at it would be lower data redundancy overheads) regardless of the data type.

So where Deduplication and Compression will get minimal/no savings for data such as Video files, Erasure Coding still provides savings so the delta between Nutanix and HPE SVT will only increase in Nutanix favour the less the customer data will dedupe and/or compress.

HPE SVT on the other hand has a RAID (RAID 6 being N-2 usable or RAID 60 being N-4 usable) overhead and on top of that, use replication (2 copies / 50% usable) for an usable capacity (of raw) of well below 50% depending on the number of drives per node.

Nutanix, using RF2 and EC-X provides between 50% (minimum) and 80% (maximum) usable capacity of RAW and with RF3 (N+2) between 33% (minimum) and 66% (maximum) usable excluding the benefits of compression and deduplication.

The next major factor in data efficiency ratios is how they are measured!

In Part 1 I have already covered how misleading HPE SVT’s 10:1 efficiency guarantee is, and this is a great example of why it can be difficult to compare apples/apples between vendors. Nutanix on the other hand does not measure data efficiency in the same misleading manner.

In Summary:

  1. Nutanix AOS 5.1 has comprehensive data reduction/efficiency reporting within the PRISM HTML GUI
  2. Nutanix data reduction capabilities exceed that of HPE SVT as both products have Dedupe and Compression, but Erasure Coding (EC-X) is only supported on Nutanix
  3. All data reduction capabilities on Nutanix are complimentory, so Dedupe , Compression and Erasure Coding can all work together to maximise savings.
  4. Erasure Coding provides data reduction even for data which is not compressible or dedupeable
  5. Nutanix data efficiency stats are easily visible in the PRISM GUI and are much more detailed than HPE SVT

Return to the Dare2Compare Index:

But wait, there’s more!

As far as data reduction results are concerned, they are all over twitter and a simple search comes up with many examples. The first one being my favorite. Not because of the data reduction ratio itself but because it shows one of the major values of a 100% software solution where a simple software upgrade (which is one-click rolling, non-disruptive) provided the customer a significantly higher data reduction ratio. So basically, the customer got more capacity for free!

Note: None of the below show the latest data efficiency reporting capabilities from AOS 5.1.

Here are a few other examples which I found using this Twitter search: